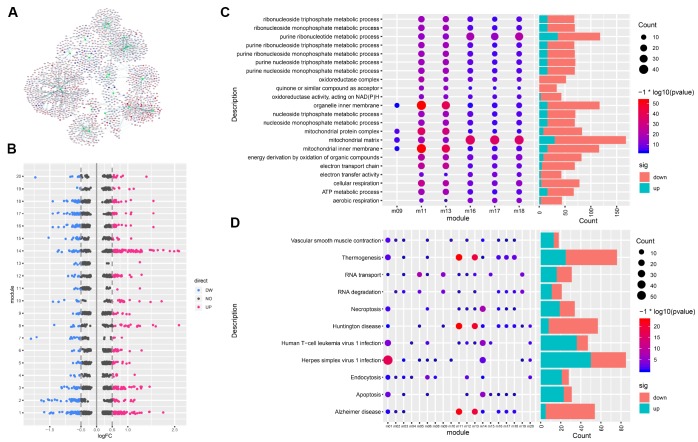
Figure 3.
Gene modules and functional enrichment. (A) Gene modules and related genes. The green node indicates the module; red, genes upregulated in AD; blue, genes downregulated in AD. (B) Differentially expressed genes in each module. (C) GO Enrichment Analysis. Enrichment increases significantly going from blue to red. The larger the circle, the more significant the proportion of module genes present among GO functional entry genes. (D) Enrichment analysis of KEGG pathway of the module gene. From blue to red, the enrichment increases significantly. The larger the circle, the more significant the proportion of module genes present among KEGG pathway entry genes.

