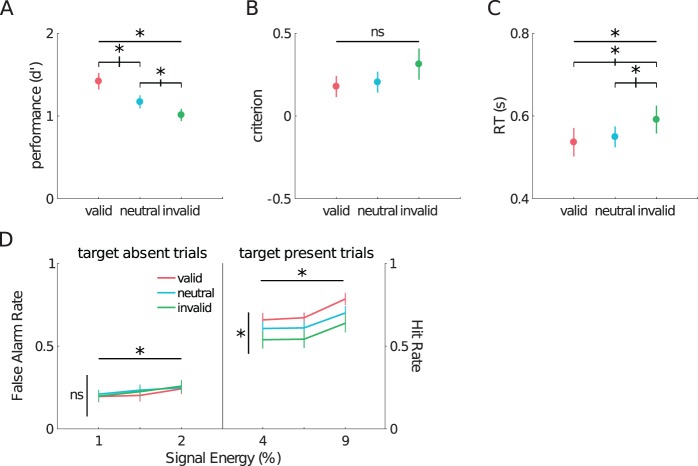
Figure 2.
Exogenous Attention's effect on behavior and energy. Behavior (A–C). Detection performance as measured by d' (A), criterion (B), and RT (C) for all experimental conditions. Colored dots are the group mean. (D) Behavior as a function of energy. False alarm and hit rate for target absent and present trials as a function of energy (binned into quartiles). The horizontal significance lines depict differences between energy strength. The vertical significance lines depict differences across experimental conditions. All error bars are SEM. *p < 0.01.

