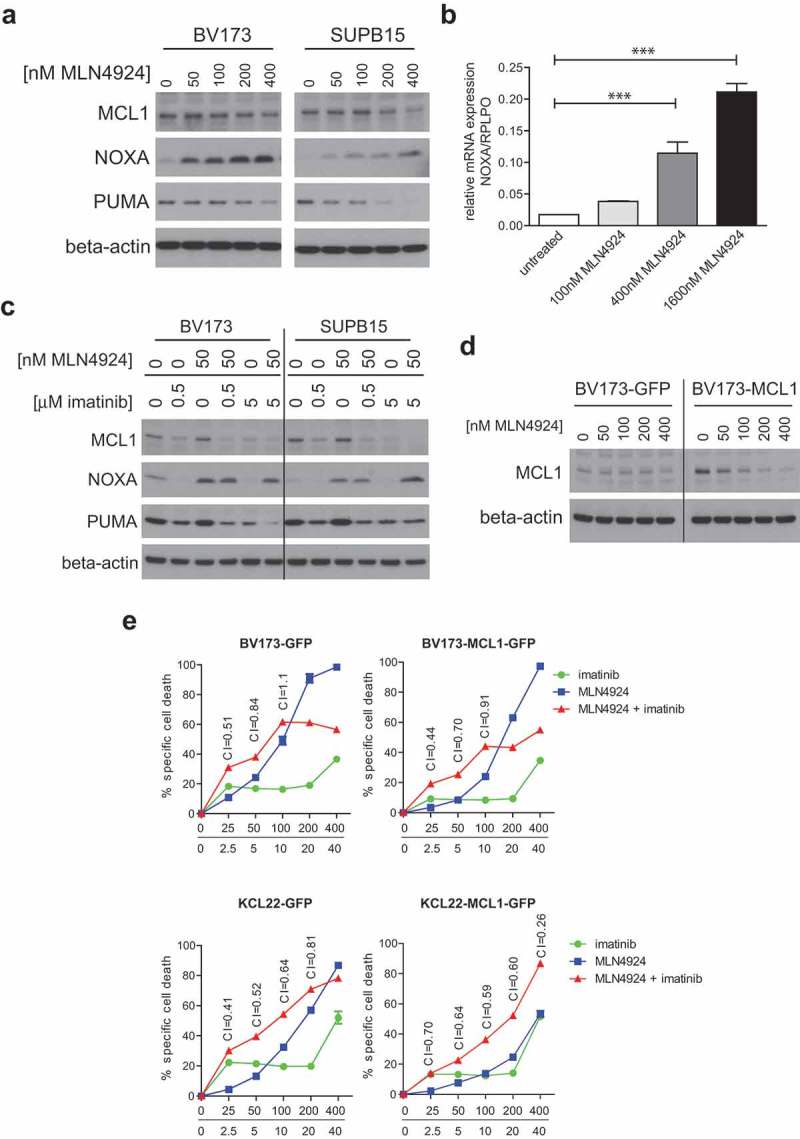
Figure 6.

MLN4924 and imatinib treatment alters the MLC1/NOXA balance in Ph+ leukemia cells. (a) Immunoblotting analysis of MCL1, NOXA, and PUMA protein expression in BV173 and SUPB15 cells overnight exposed to various concentrations of MLN4924. Beta-actin blotting was used to control for loading. (b) Quantitative RT-PCR analysis of NOXA expression in BV173 cells overnight exposed to various concentrations of MLN4924. The ratio of NOXA/RPLPO (housekeeping gene) expression is depicted. Means ± SEM of three independent experiments are shown, PCRs were performed in triplicate (*** p < 0.001, One-way ANOVA, Dunn’s post-test). (c) Immunoblot analysis of MCL1, NOXA and PUMA protein levels in BV173 and SUPB15 cells treated overnight with MLN4924 and imatinib, at the indicated concentrations. β-catenin- blotting was used to control for loading. (d) Immunoblot analysis of MCL1 protein expression in BV173 cells transduced with empty vector (BV173-GFP) or with retroviral MCL1 overexpression construct (BV173-MCL1). Cells were treated overnight with various concentrations of MLN4924 as indicated. Beta-actin blotting was used to control for loading. (e) MCL1 overexpression diminishes the sensitivity for MLN4924 and imatinib but does not abrogate synergy. BV173-MCL1 and BV173-GFP cells (upper panels) and KCL22-MCL1 and KCL22-GFP (lower panels) were treated for 3 days with various concentrations of MLN4924 and imatinib at a fixed ratio of 1:100, CI values for relevant data point are indicated. Means ± SEM of percent specific cell death are depicted in the graphs.
