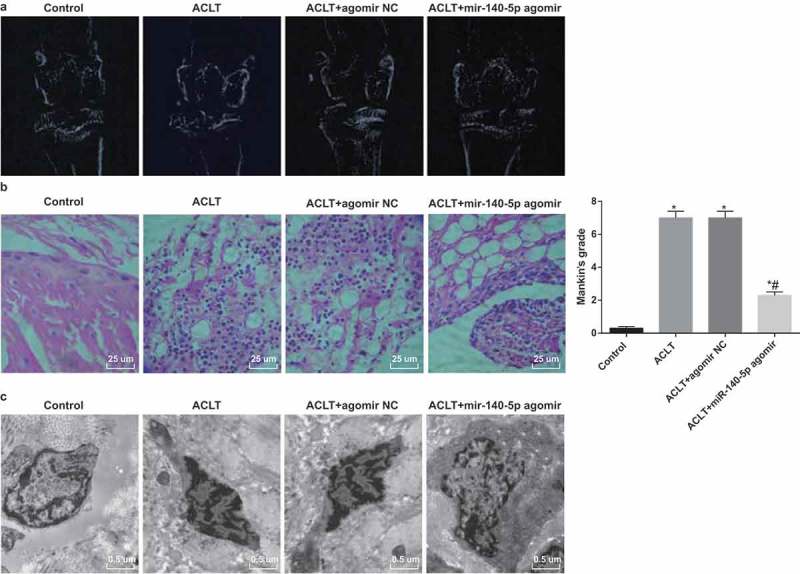
Figure 2.

Upregulated miR-140-5p inhibits KOA development in synovial tissues of rats. a, X-Ray iconography images; b, results of HE staining (× 400) and Mankin score; c, results of electron microscope observation (15,000 ×). N = 10, * P < 0.05 vs the control group, # P < 0.05 vs the ACLT group. The measurement data conforming to the normal distribution were expressed as mean ± standard deviation. ANOVA was used for comparisons among multiple groups. Tukey’s multiple comparisons test was used for pairwise comparisons after ANOVA.
