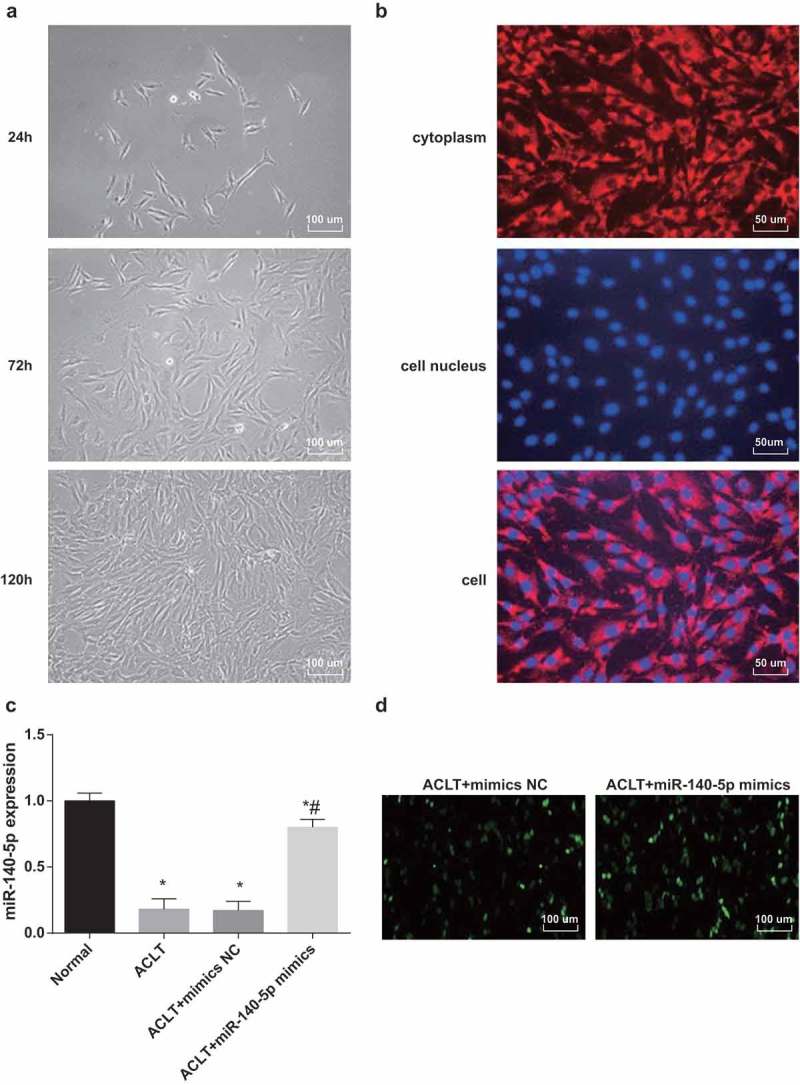
Figure 6.

The cultured cells were rats’ synovioblasts.a, chart of primary synovioblasts (100 ×); b, appraisal charts of synovioblasts (200 ×), respectively, were expression of VCAM-1 in synovioblasts, nucleus of synovioblasts and VCAM-1 was expressed in all the cells; c, the expression of miR-140-5p was detected by RT-qPCR; d, the results of fluorescence microscope observation (100 ×), * P < 0.05 vs the control group, # P < 0.05 vs the ACLT group. The experiment was repeated for three times. The measurement data conforming to the normal distribution were expressed as mean ± standard deviation. ANOVA was used for comparisons among multiple groups. Tukey’s multiple comparisons test was used for pairwise comparisons after ANOVA.
