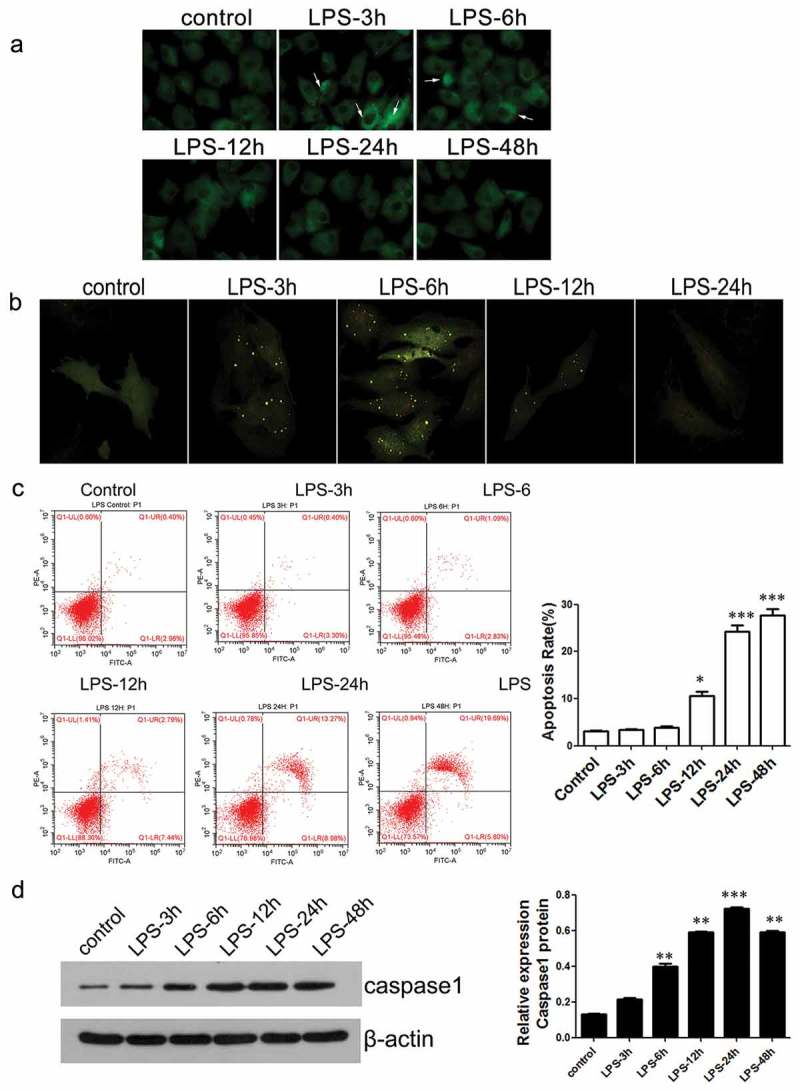
Figure 3.

The levels of autophagic activity and cell apoptosis in chondrocytes after different treatment time with LPS.
(a) Chondrocyte autophagic activity was detected by MDC staining (×400). (b) Expression of intracellular RFP- GFP-LC3 was observed using fluorescence microscope (×200). Detection of apoptosis of chondrocytes by flow cytometry. (d) The expression level of caspase-1 was detected using Western blot. *P < 0.05, **P < 0.01, ***P < 0.001 vs. control
