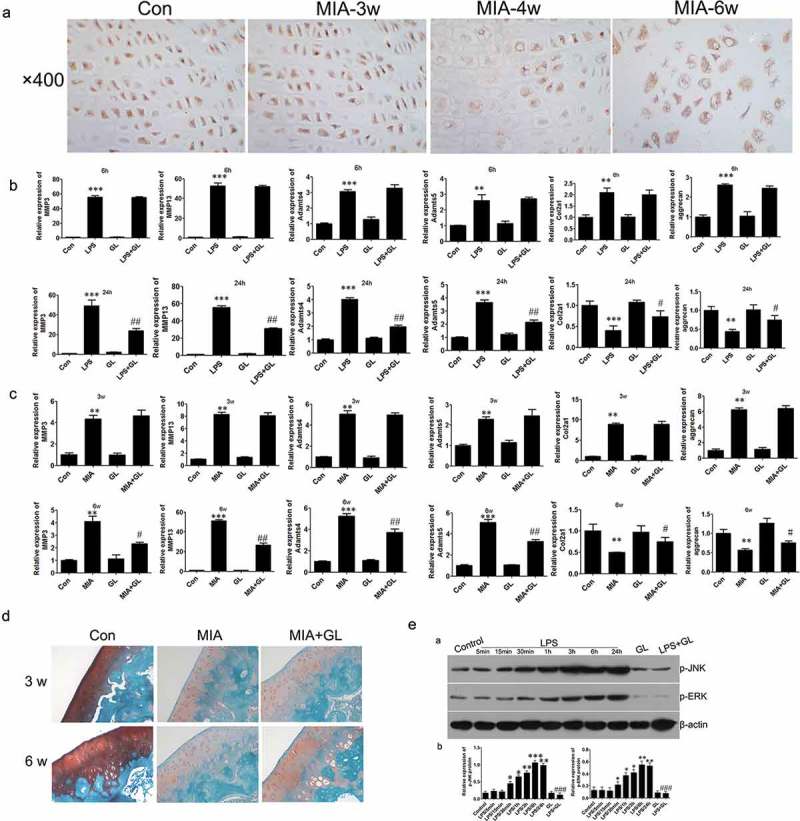
Figure 7.

Regulation of autophagy in mice.
(a) IHC assay was performed to assess HMGB1 expression level (×400). Relative mRNA levels were evaluated using Q-PCR in vitro(b) and in vivo(c) respectively (d) Safranin O staining of the joint tissue (×100). (e) Western blot analysis of the expression of p-JNK and p-ERK. Data are expressed as Mean±SEM (n = 3). Values with p < 0.05 were considered to be statistically significant. **P < 0.01, ***P < 0.001 vs. control group; #P < 0.05 vs. LPS 24 h group.
