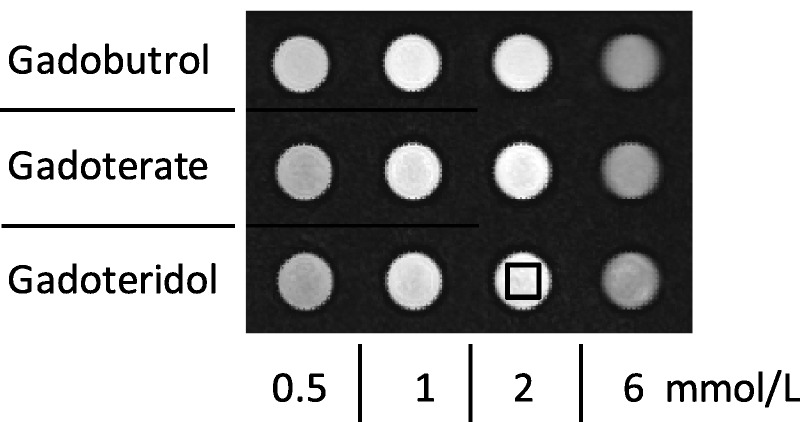
FIGURE 1.

IR-TSE images with inversion time (TI) of 750 milliseconds at 3 T of a series of blood samples, illustrating the determination of the SI in the samples. The black box indicates the ROI that was used in each sample to determine the SI in the center of each vial.
