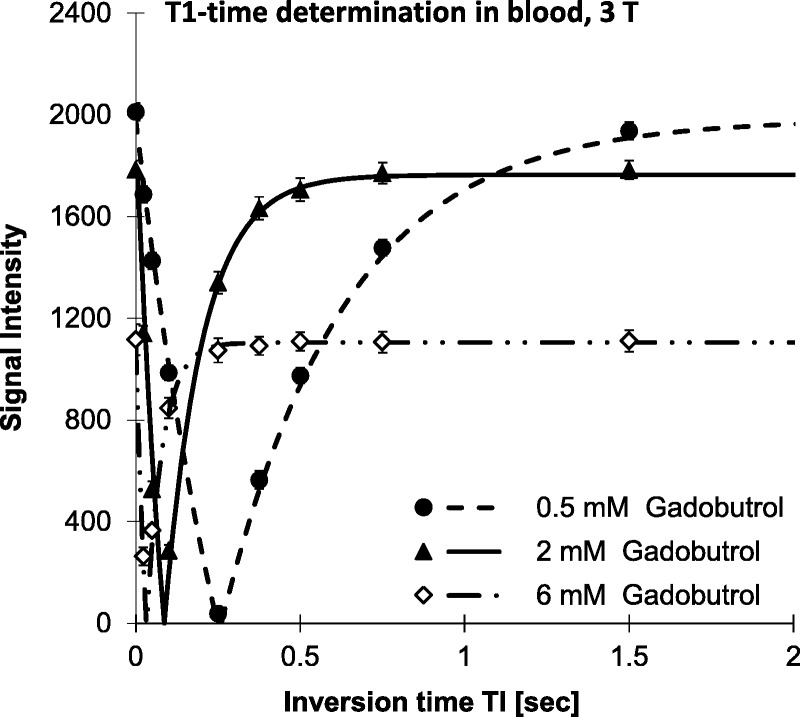
FIGURE 2.

Plot of the relaxation curve of the signal intensities at 3 T in blood samples with different concentrations of gadobutrol using different inversion times (TI). The lines represent the fit of the measured signal intensities (SI) to Equation 1. The error bars represent the scatter of the SI within each ROI. This yields the T1-time of the respective sample.
