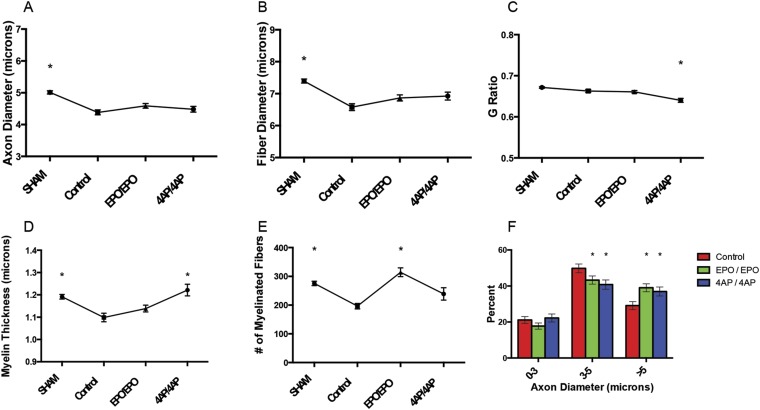
Fig. 2.
Comparison of axon diameter (Fig. 2-A), fiber diameter (Fig. 2-B), G ratio (Fig. 2-C), myelin thickness (Fig. 2-D), number of myelinated fibers (Fig. 2-E), and axon diameter histogram (Fig. 2-F) among the sham-operation, untreated (control), EPO/EPO, and 4-AP/4-AP groups after the 6-week compression phase. The values are given as the mean and SEM. *A significant difference (p < 0.05) when compared with the untreated (control) group. See Appendix for specific significant p values.

