
Fig. 1. Effect of high fat diet (HFD) and cinnamaldehyde (CNM) on estrus cycle in wild type (WT) and Nrf2 KO mice. Glucose tolerance and insulin sensitivity in HFD fed mice. Insulin tolerance test (ITT) in wild type (WT) and Nrf2 KO mice.
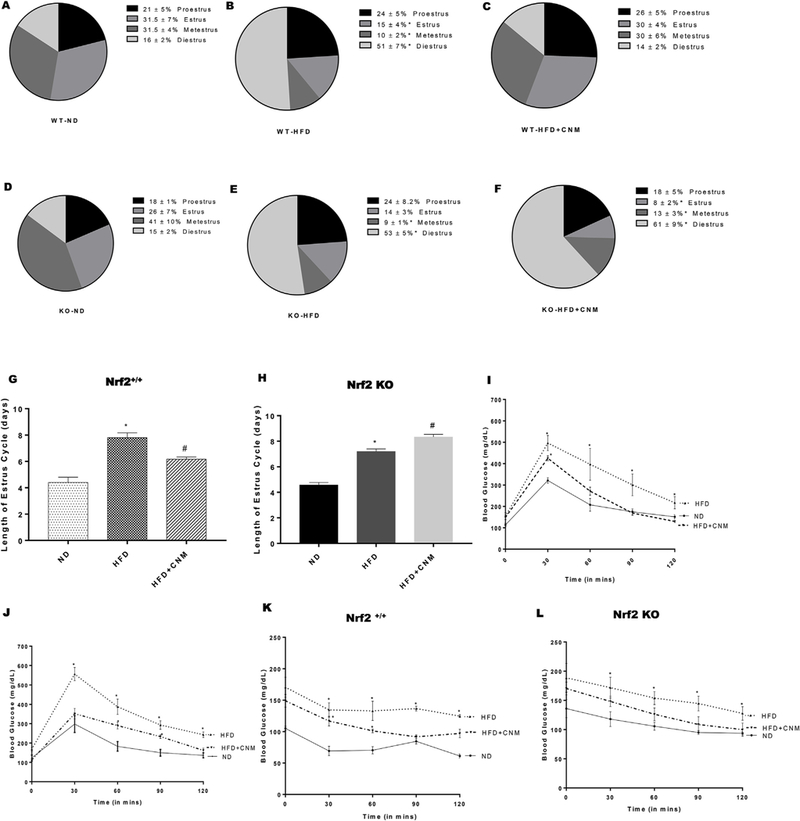
(A–F) Representation of cycling days (G-H). (I, J) Intraperitoneal glucose tolerance test (IPGTT); profile of blood glucose concentration versus time; (K, L) profile of blood glucose concentration (percentage of initial value) as a function of time upon intraperitoneal injection of insulin. Data were analyzed using one way ANOVA by using graph pad prism software. Data are means ± SEM (n = 6). *P < 0.05 compared with normal diet (ND) mice; #P < 0.05 compared to HFD mice.