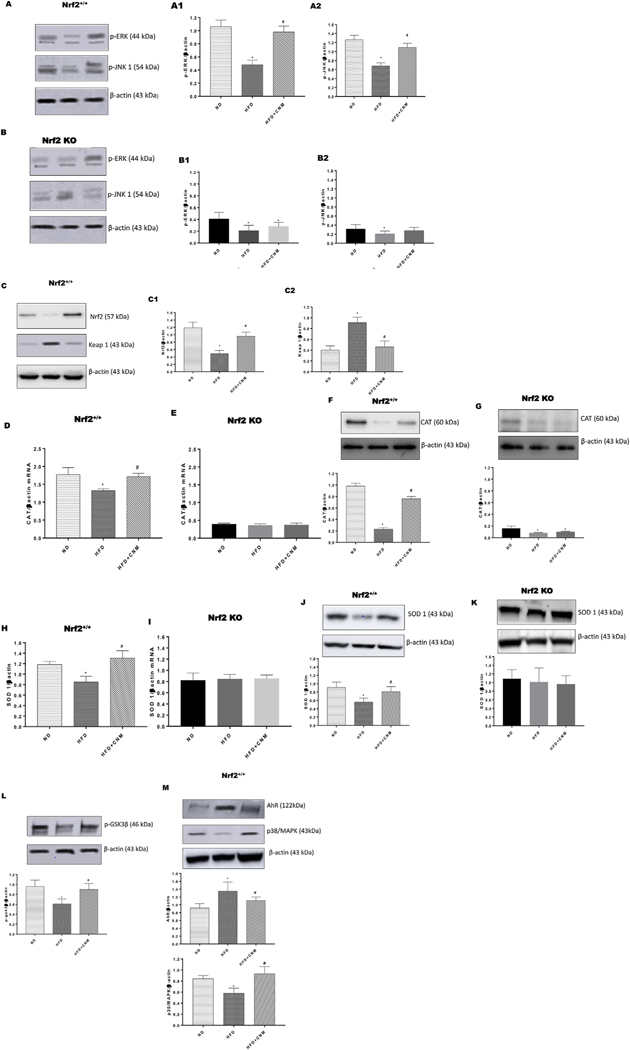
Fig. 4. Effect of cinnamaldehyde (CNM) on protein expressions of wild type (WT) and Nrf2 KO female mice in gastric neuromuscular tissues.

Representative immunoblot and densitometry analysis data for (A1–2) p-ERK/JNK protein expression in WT, (B1–2) p-ERK/JNK protein expression in Nrf2 KO, (C1–2) Nrf2/KEAP-1 protein expression in WT, (D) CAT mRNA expression in WT, (E) CAT mRNA expression in Nrf2 KO, (F) CAT protein expression in WT, (G) CAT protein expression in Nrf2 KO, (H) SOD 1 mRNA expression in WT, (I) SOD 1 mRNA expression in Nrf2 KO, (J) SOD-1 protein expression in WT, (K) SOD-1 protein expression in Nrf2 KO (L) p-GSK3β protein expression and (M) AhR/p38 MAPK protein expression in WT female mice gastric neuromuscular tissue. Stripped blots were re-probed with β-actin. Data were normalized with housekeeping gene or protein (β-actin). Bar graphs showed a ratio of target gene or protein with β-actin. Data were analyzed using one way ANOVA by using graph pad prism software. Values are mean ± SE (n = 4). *p < 0.05 compared with ND; #p < compared with HFD fed mice.
