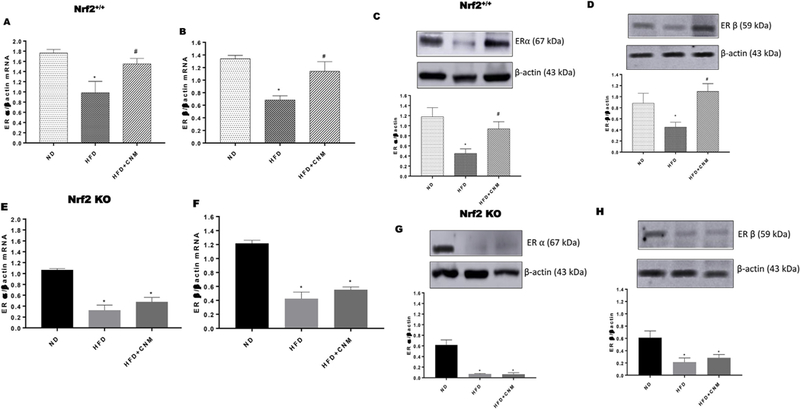
Fig. 5. Effect of cinnamaldehyde (CNM) on mRNA and protein expressions of estrogen receptor alpha (ER α) and estrogen receptor beta (ER β) in wild type (WT) and Nrf2 KO female mice gastric neuromuscular tissues.

Representative immunoblot and densitometric analysis data for (A) ER α mRNA expression in WT, (B) ER α mRNA expression in WT, (C) ER α protein expression in WT, (D) ER β protein expression in WT, (E) ER α mRNA expression in Nrf2 KO, (F) ER β mRNA expression in Nrf2 KO, (G) ER α protein expression in Nrf2 KO, (H) ER β protein expression in Nrf2 KO in female mice gastric neuromuscular tissue. Stripped blots were re-probed with β-actin. Data were normalized with housekeeping gene or protein (β-actin). Bar graphs showed a ratio of target gene or protein with β-actin. Data were analyzed using one way ANOVA by using graph pad prism software. The values are mean ± SEM (n = 4). *p < 0.05 compared with control group; #p < compared with the diabetic group.
