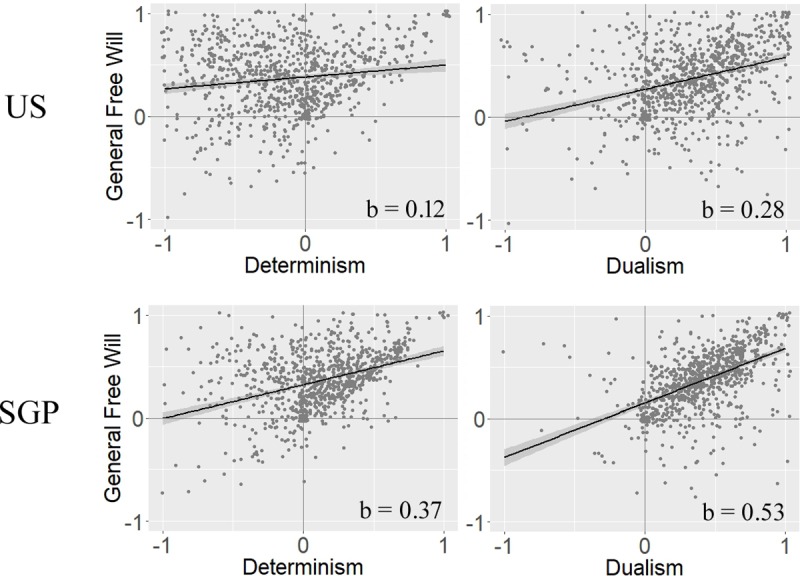
Fig 2. FWI sub-scale correlations.

On the left, correlations between general free will beliefs and determinism are depicted, for the United States (US, n = 900, above) and Singapore (SGP, n = 900, below). On the right the relation between general free will beliefs and dualism is depicted. Each dot represents a single subject. Positive values represent belief in e.g. free will, negative values represent disbelief. For illustration purposes, the single subject data was slightly jittered to better depict its density. Black lines are fitted linear models, which are drawn with a 90% confidence interval (dark gray area) and the corresponding b value.
