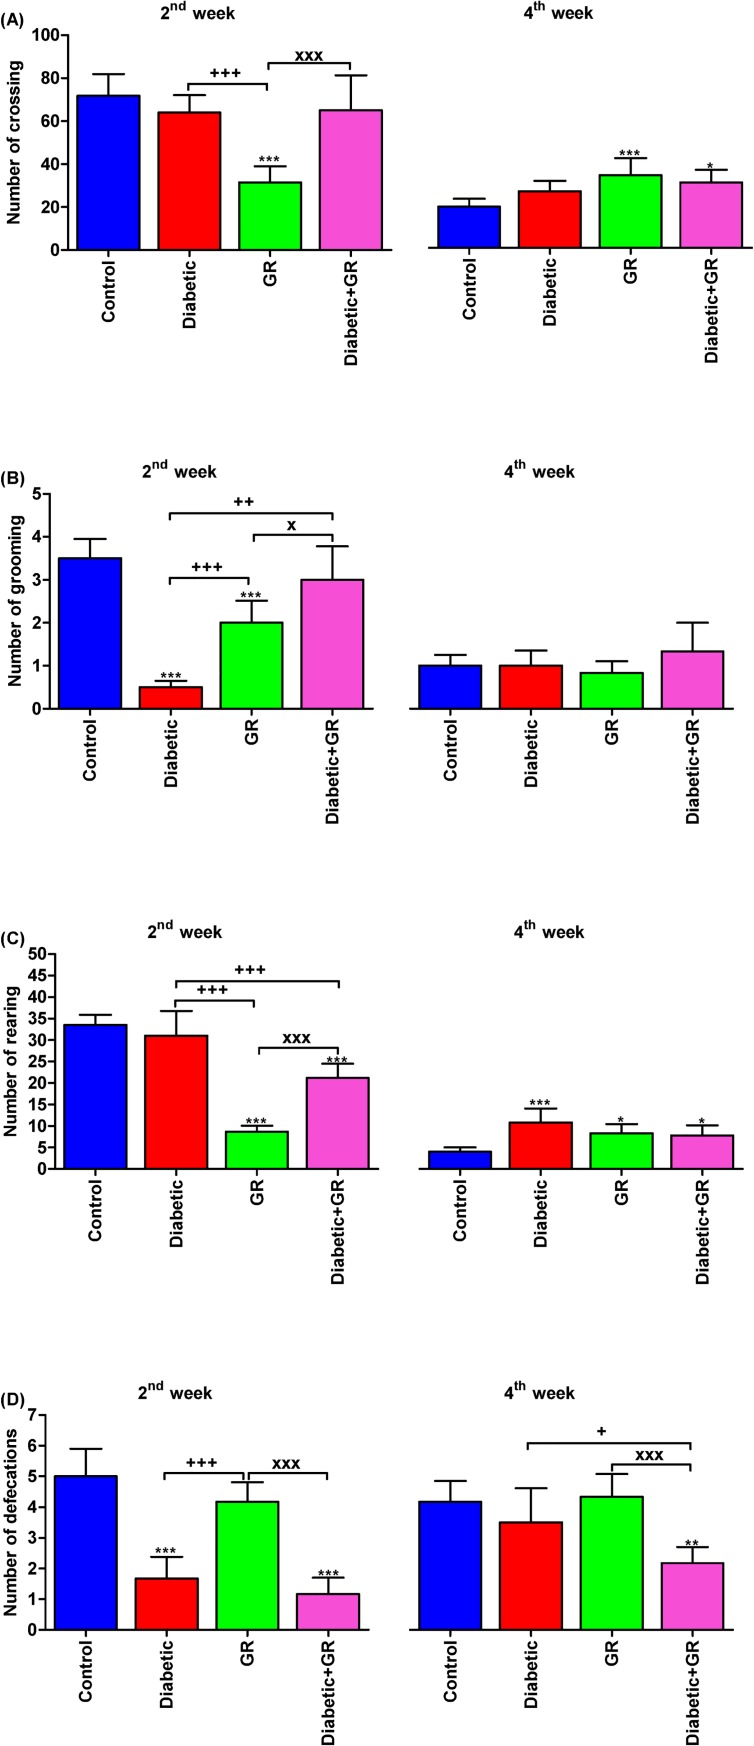
Fig 1. Open field test in diabetic and graviola-treated rats.
(A) number of crossing, (B) number of grooming, (C) number of rearing, and (D) number of defecations. *P < 0.05, **P < 0.01, and ***P < 0.001 vs. Control. +P < 0.05, ++P < 0.01, and +++P < 0.001 vs. Diabetic. xP < 0.05 and xxxP < 0.001 vs. Diabetic+GR. Statistical analysis was performed using one-way ANOVA and Tukey's post hoc test for multiple comparisons. GR, graviola.

