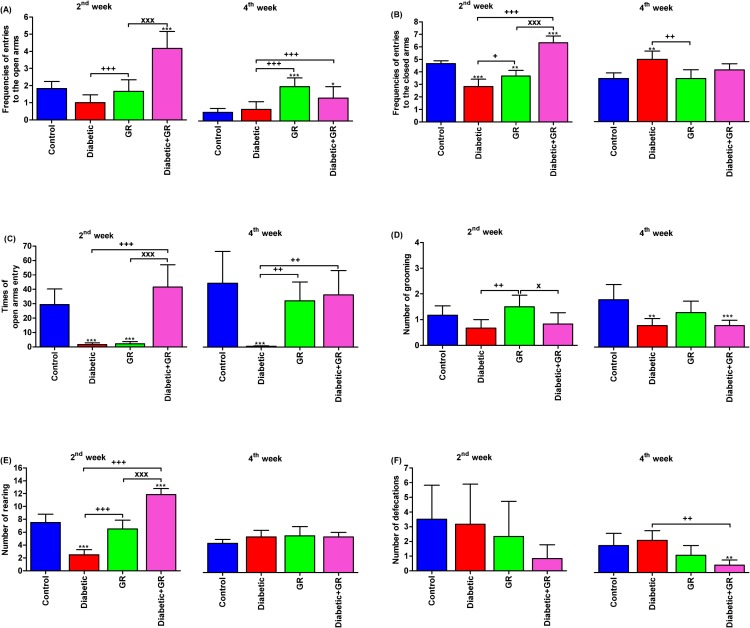
Fig 2. Elevated plus maze in diabetic and graviola-treated rats.
(A) frequencies of entries to the open arms, (B) frequencies of entries to the closed arms, (C) times of open arms entry, (D) number of grooming, (E) number of rearing, and (F) number of defecations. *P < 0.05, **P < 0.01, and ***P < 0.001 vs. Control. +P < 0.05, ++P < 0.01, and +++P < 0.001 vs. Diabetic. xP < 0.05 and xxxP < 0.001 vs. Diabetic+GR. Statistical analysis was performed using one-way ANOVA and Tukey's post hoc test for multiple comparisons. GR, graviola.

