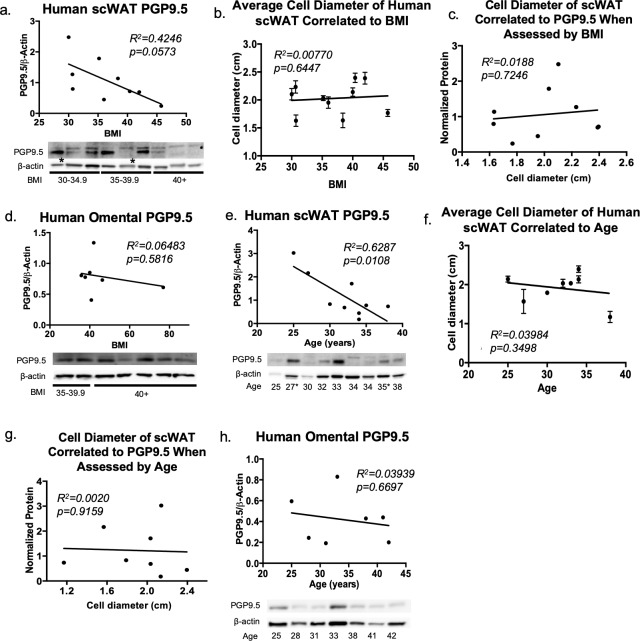
Fig 3. Human subcutaneous and omental white adipose tissue innervation.
In human scWAT, protein levels of pan-neuronal marker PGP9.5 were measured by western blotting; linear regression analysis was performed for assessment of normalized protein levels compared to body mass index (BMI) (a). Average cell diameter in scWAT of human samples when assessed by BMI (b), and normalized protein expression plotted against average cell size (c). Protein levels of PGP9.5 were measured in omental adipose by western blotting; linear regression analysis was performed for assessment of normalized protein levels compared to BMI (d). Protein levels of PGP9.5 measured in human scWAT, linear regression analysis was performed for assessment of normalized protein levels compared to age (e). Average cell diameter in scWAT of human samples when assessed by age (f), and normalized protein expression plotted against average cell size (g). Protein levels of PGP9.5 were measured in omental adipose by western blotting; linear regression analysis was performed for assessment of normalized protein levels compared to age (h). Western blot data were normalized to β-actin, band intensities were quantified in Image J, and analyzed by two-tailed Student’s t-test. Protein expression was normalized to β-Actin and band intensities were quantified in Image J. Cell diameter was measured from images of histological cross-sections of adipose tissue from each patient, averaged (n = 3), and analyzed by linear regression. Due to limitations of available samples from the BNORC adipose tissue core at Boston Medical Center, the BMI distribution of omental adipose was clustered around 40. Error bars are SEMs. For (a,e) N = 9 BMI cohort, N = 9 Age cohort. For (a,e) * indicates individuals with diagnosed diabetes. The majority of human samples were females, see S1–S3 Tables for clinical details.

