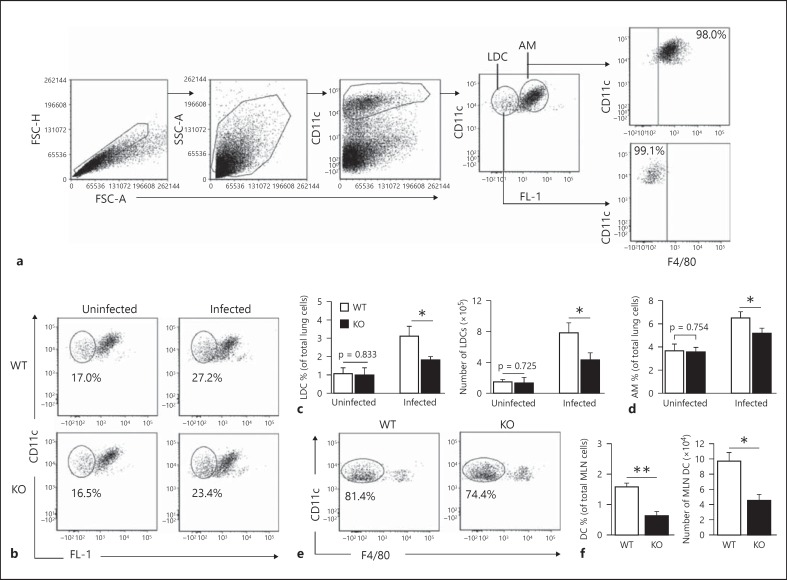
Fig. 1.
LDCs in KO mice show reduced expansion after Cpn infection. KO and WT mice (3 in each group) were intranasally infected with Cpn (3 × 10⁶ IFUs/mouse) and sacrificed at day 3 p.i. Lungs and MLNs were harvested from the mice and processed into single-cell suspensions. a Flow cytometric gating strategy for analysis of LDCs. CD11chi non-autofluorescent and CD11clow autofluorescent lung cells were gated and analyzed as LDCs and AMs, respectively. Analysis was performed on gated CD11chi non-autofluorescent lung cells. F4/80 was used to confirm whether CD11chi non-autofluorescent cells represent LDCs. b Representative flow cytometric images showing the frequency of LDCs after infection. c Graphs representing the percentage and absolute numbers of LDCs. The absolute numbers were calculated as the percentage of CD11chi non-autofluorescent lung cells × total number of lung cells/100. d Graphs representing the percentage of AMs of all the lung cells. e CD11c+F4/80− cells in the MLNs were analyzed as DCs. Flow cytometric images are shown. f Graphs representing the percentage and absolute numbers of DCs in the MLNs. Data are shown as mean ± SD. One of the 2 independent experiments with similar results is shown. * p < 0.05; ** p < 0.01.

