Fig. 8.
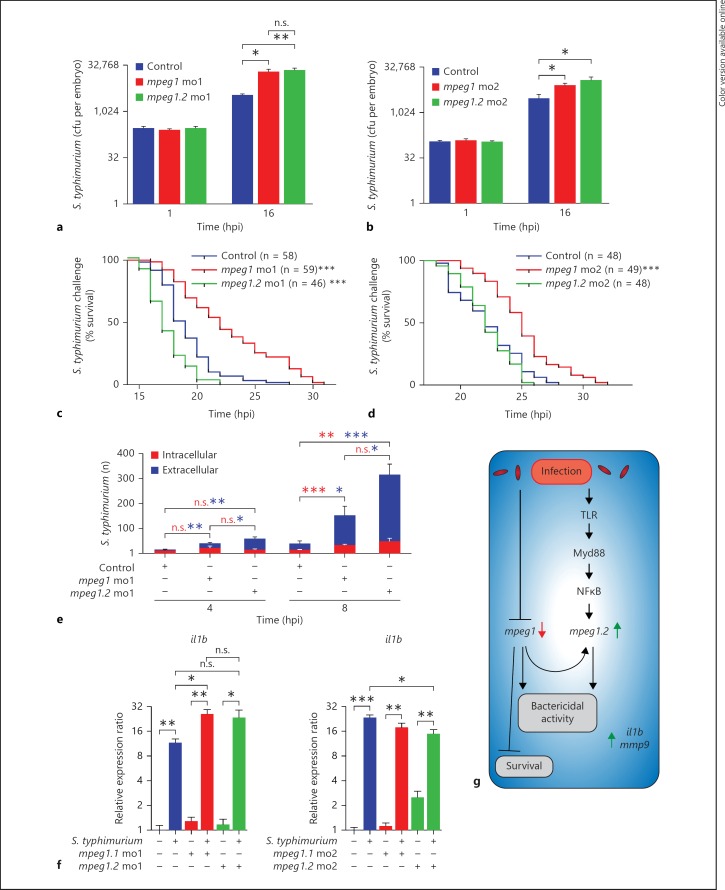
mpeg1 and mpeg1.2 knockdown increase the bacterial burden and pro-inflammatory gene expression but have opposite effects on host survival during S. typhimurium infection. a, b Quantification of the bacterial burden. mpeg1 and mpeg1.2 morphants [morpholino 1 (a) and morpholino 2 (b)] and control embryos were injected with Ds-Red-expressing S. typhimurium SL1027 bacteria (200 cfu) and PBS as a mock control. Embryos were homogenized and plated at 1 and 16 hpi to determine S. typhimurium cfu counts (n = 5 per group, 2 biological replicates, log2 scale). c, d Survival rates. The percentage of survival of infected mpeg1 morphants, mpeg1.2 morphants [morpholino 1 (c) and morpholinos 2 (d)] and control embryos was determined over a time course of 32 hpi. DsRed-expressing S. typhimurium SL1027 bacteria were injected into the blood circulation (150 cfu). Survival curves of mpeg1 morphants, mpeg1.2 morphants and control embryos are shown (1 representative experiment of 3 individual experiments). e Quantification of intracellular and extracellular S. typhimurium over the duct of Cuvier in control embryos, mpeg1 morphants and mpeg1.2 morphants at 4 and 8 hpi (representative confocal images are shown in online suppl. fig. 4). Statistical significance is indicated for intracellular S. typhimurium (red asterisks) and extracellular S. typhimurium (blue asterisks) (calculated from confocal images of n = 6–8 embryos per group). f Pro-inflammatory gene expression of il1b under the same experimental conditions as in a and b was analysed by qPCR at 16 hpi (n = 15 per group, pooled per replicate, 3 biological replicates, log2 scale). g Schematic representation of mpeg1 and mpeg1.2 regulation and their function. n.s. = Not significant; mo1 = morpholino 1; mo2 = morpholino 2.

