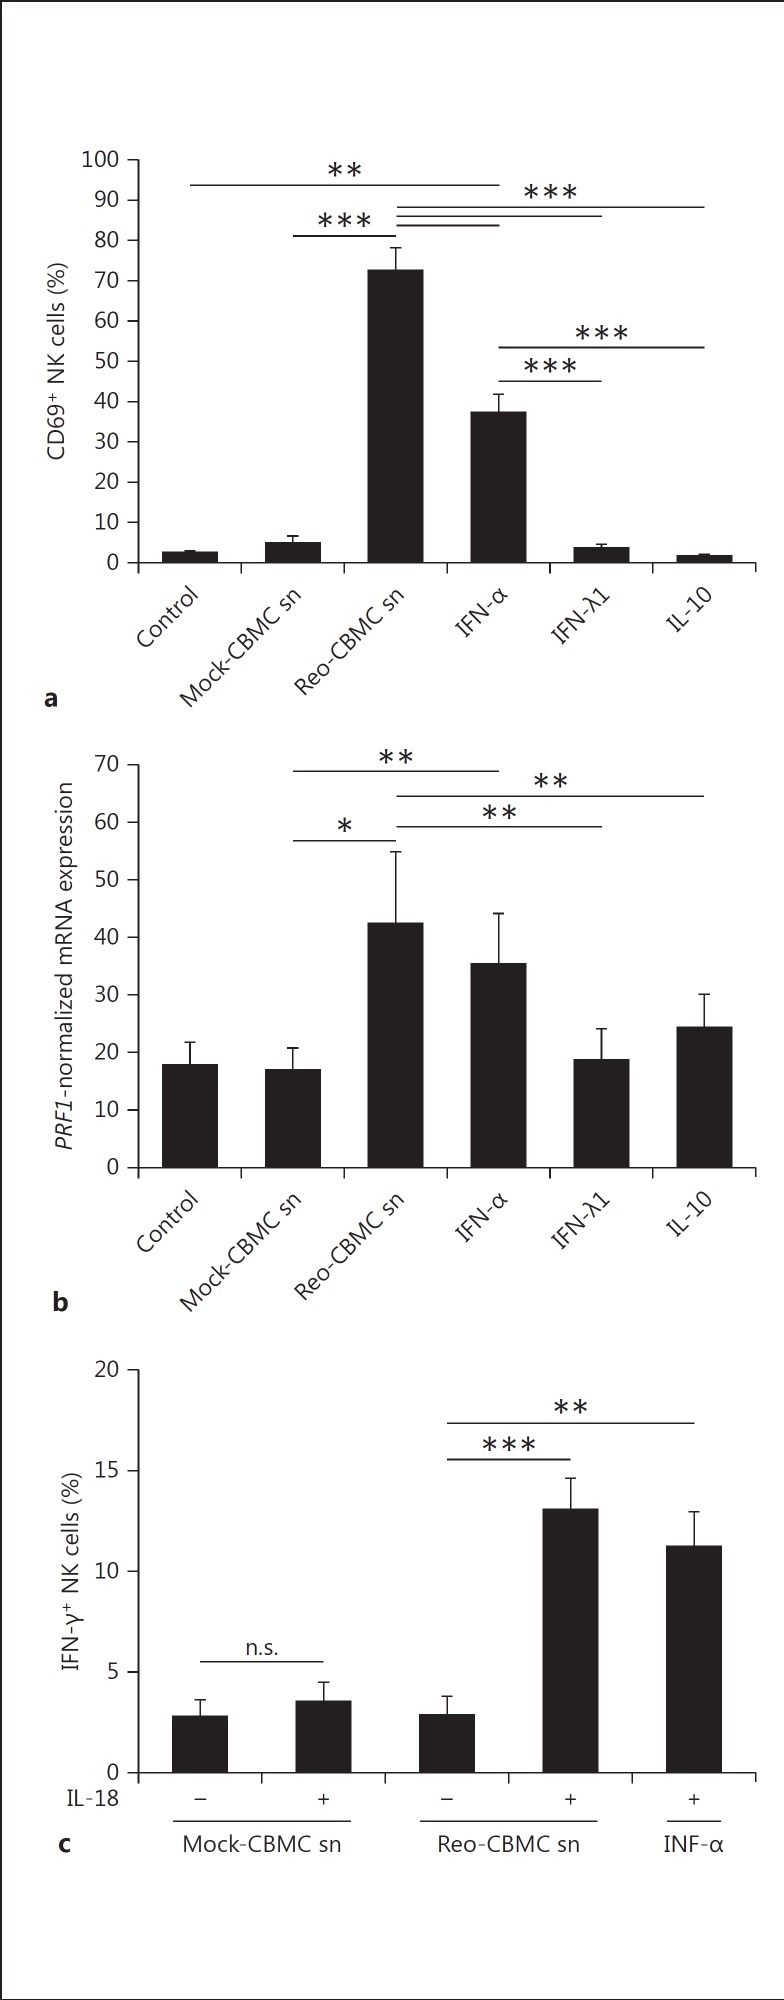
Fig. 4.
Response of NK cells to cytokines produced by reovirus-infected mast cells. NK cells were stimulated in parallel with Reo-CBMC sn, 10 ng/ml IFN-α2a, 100 ng/ml IFN-λ1 or 30 ng/ml IL-10 for 24 h. Mock-CBMC sn and 10% RPMI (control) were used as negative controls of stimulation. a CD69 upregulation (n = 5) was analyzed by FACS. bPRF1 gene expression (n = 6) was analyzed by qPCR. Results are shown as normalized to GAPDH. c For IFN-γ production (n = 5), IL-18 was added when indicated. Intracellular IFN-γ was analyzed by FACS. Data were compared using repeated-measures ANOVA with the Tukey post hoc test. * p < 0.05, ** p < 0.01, *** p < 0.001. Results are presented as the mean ± SEM from at least 3 independent experiments performed on at least 5 different donors. n.s. = Not significant.

