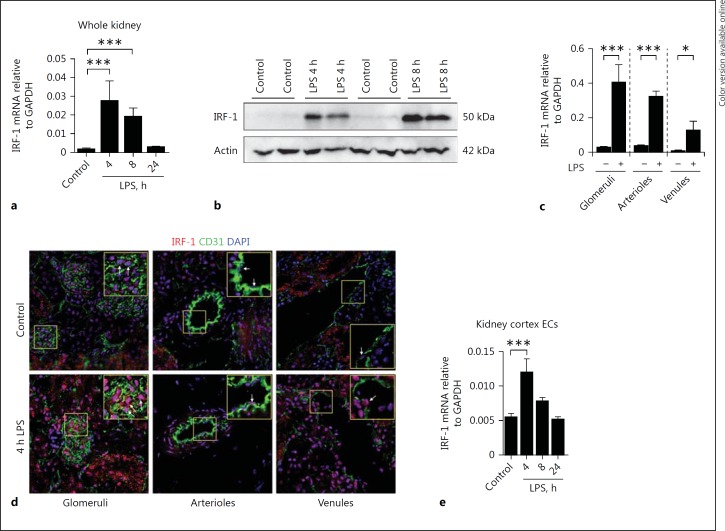
Fig. 1.
IRF-1 is upregulated in the renal microvasculature of LPS-treated mice. a Renal mRNA expression of IRF-1 in control and LPS-challenged (0.5 mg/kg i.p.) mice for the time points indicated. Bars represent the mean ± SD of 5 mice per group. b Representative immunoblot of IRF-1 protein levels determined in whole kidney extracts of control (vehicle treated) mice and mice challenged with LPS (1 mg/kg, i.p.) and sacrificed after 4 and 8 h, respectively. Actin was used as a reference for protein loading. c mRNA expression levels of IRF-1 in renal microvascular compartments that were laser microdissected from kidneys of vehicle-treated (-) mice, and mice sacrificed 4 h after LPS administration (+). Bars represent the mean ± SD of 3 mice per group. d Immunofluorescence staining of endothelial marker CD31 (green), IRF-1 (red), and DAPI nuclear staining (blue) in the kidney of control mice (vehicle treated) and mice challenged with LPS (1 mg/kg, i.p.) and sacrificed 4 h later. All images were taken with equal exposure times. Original magnification ×400. e IRF-1 mRNA expression in primary mouse renal cortex endothelial cells (ECs) stimulated with LPS (1 µg/mL) or vehicle (control) for the indicated time periods. Bars represent the mean ± SD of 4 samples and are representative of 2 independent experiments. All mRNA expression levels were determined by RT-qPCR using GAPDH as the housekeeping gene. Bars represent the mean ± SD. * p < 0.05, *** p < 0.001.

