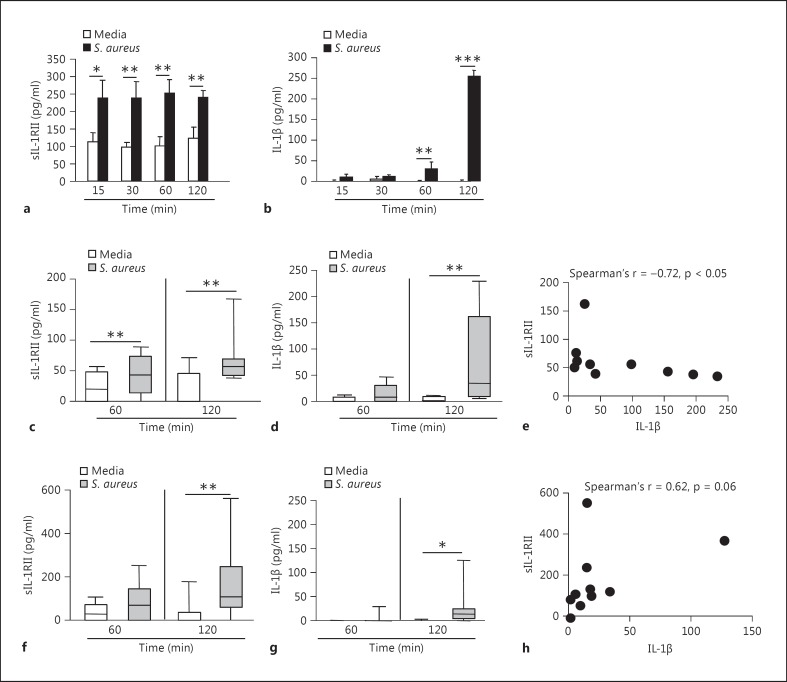
Fig. 4.
Kinetics of IL-1β and sIL-1RII production in response to S. aureus. THP-1 cells (a, b), monocytes (c-e) and neutrophils (f-h) were stimulated for different periods of time with S. aureus or media alone and the induction of sIL-1RII (a, c, f) and IL-1β (b, d, g) was determined by ELISA. a, b Data are presented as the mean and standard deviation of triplicate wells from 1 representative experiment out of 3. * p < 0.05; ** p < 0.01; *** p < 0.001, Student's t test. c, d, f, g Boxes and whiskers depict maximum and minimum values obtained from individual donors, 8-10 per group, and the horizontal line represents the median for each group. * p < 0.05; ** p < 0.01, Wilcoxon matched-pairs signed rank test. e, h Correlation analysis of the induction of sIL-1RII versus IL-1β production at 2 h poststimulus with S. aureus.

