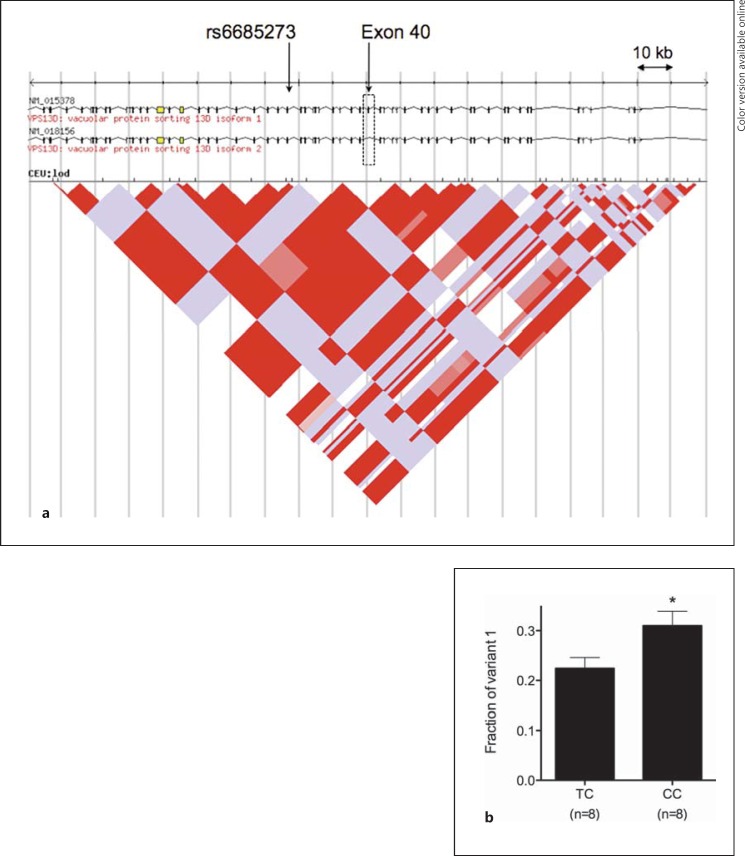
Fig. 3.
VPS13D rs6685273 is associated with altered fraction of transcript variants of VPS13D. a Linkage disequilibrium diagram of the VSP13D gene region including VPS13D rs6685273 and VPS13D exon 40. The diagram is from the HapMap European ancestry data and is centered on exon 40 covering a 200-kb gene region. The transcript variant 1 contains exon 40, and the variant 2 does not contain exon 40. b Fraction of transcript variant 1 by the VPS13D rs6685273 genotype. Transcript variants 1 and 2 were measured in 16 lymphoblastoid cells [CC genotype (n = 8) and TC genotype (n = 8)] by RT-PCR using primers that spanned exon 40 and yielded 2 amplicons of different size [transcript variant 1 (286 bp); transcript variant 2 (212 bp)], followed by gel electrophoresis and quantification of band intensity. The CC genotype lymphoblastoid cells had increased the expression of transcript variant 1 compared to the CT genotype (p = 0.034). The Student t test was used to calculate p values. Data are the mean ± SEM. * p < 0.05.

