Fig. 1.
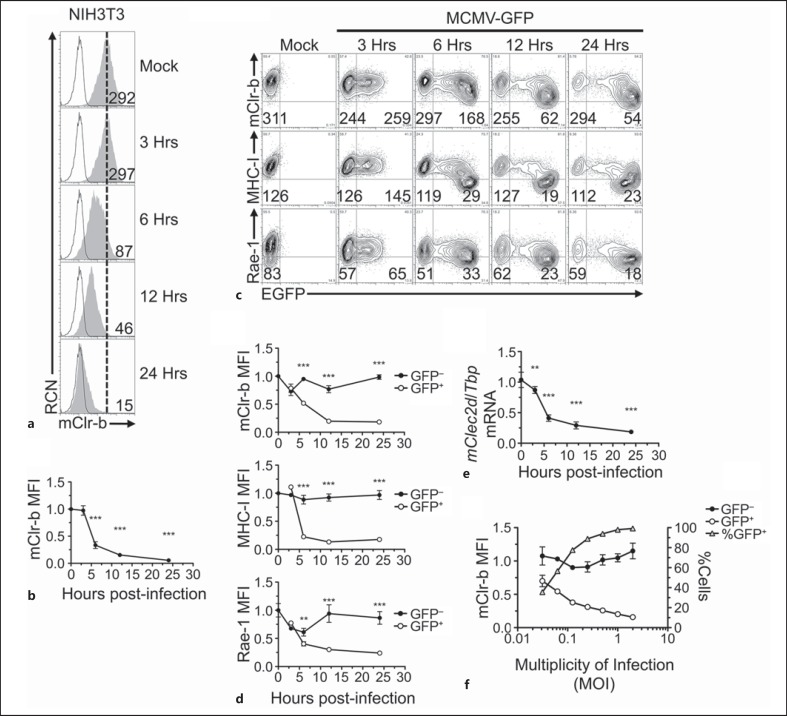
MCMV infection promotes rapid Clr-b downregulation. a NIH3T3 cells were infected with MCMV-Smith virus at a MOI of 0.5 PFU/cell over a 24-hour time course, and were analyzed by flow cytometric analysis for the cell surface expression of mClr-b. 4A6 Clr-b mAb (shaded histogram); secondary reagent alone (black line); reference for mock-treated control median fluorescence intensity (MFI) level (dotted vertical line). Numbers indicate MFI values. b Quantitation of mClr-b MFI levels in a normalized to mock-treated control levels (mean ± SEM). Statistical significance is shown between mock treatment and a given time point. c Time course of Clr-b, MHC-I and Rae-1 expression upon NIH3T3 cell infection using recombinant MCMV-GFP (MOI = 0.5 PFU/cell). Numbers represent MFI levels of the respective markers gated on GFP− (uninfected) or GFP+ (MCMV-infected) cells. d Quantitation of mClr-b, MHC-I and Rae-1 MFI levels on MCMV-GFP-infected cells in c gated by GFP expression and normalized to mock-treated controls. Statistical significance is shown between GFP− and GFP+ population. e Time course quantitation of Clr-b (Clec2d) transcript levels following MCMV infection at MOI of 0.5 PFU/cell (indexed relative to Tbp levels and normalized relative to mock-treated controls). Statistical significance is shown between mock treatment and a given time point. f Quantitation of mClr-b MFI levels and % of GFP+ cells upon MCMV-GFP infections at different MOI ratios analyzed at 22 h.p.i. Black and white circles represent GFP− and GFP+ cell subsets (corresponding with the left y-axis) and gray triangles represent % of GFP+ cells (right y-axis). Graphs show mean ± SEM. Experiments were analyzed using ANOVA with Bonferroni's post hoc analysis. * p < 0.05, ** p < 0.01, *** p < 0.001. All data are representative of at least 3 independent experiments.

