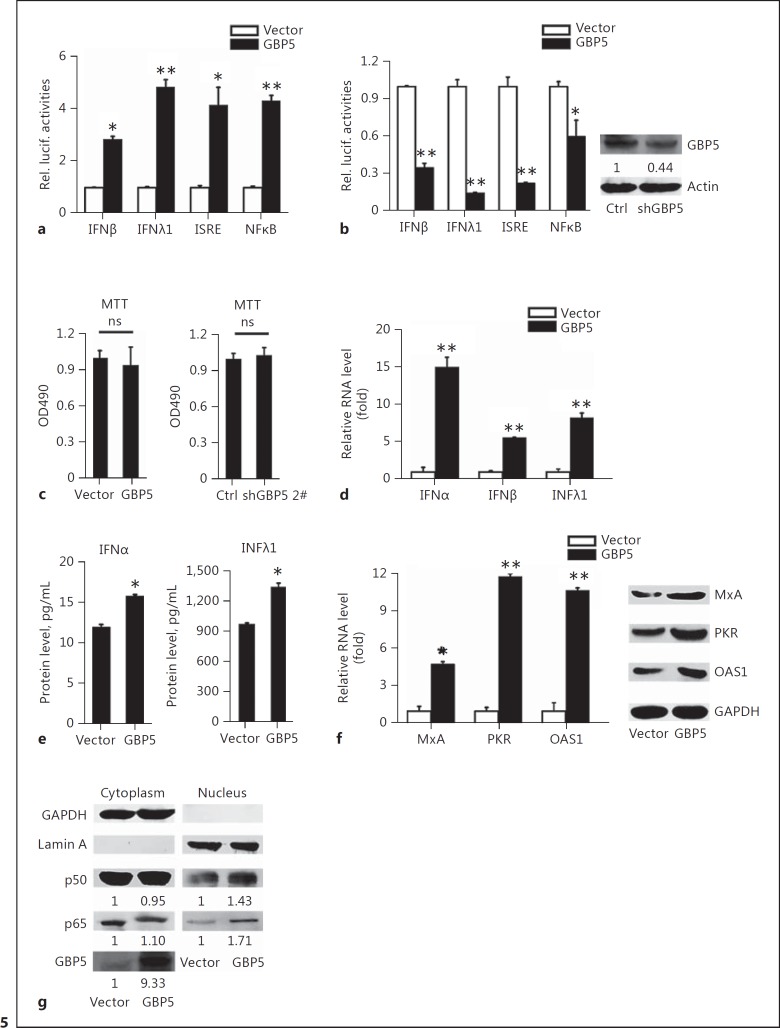
Fig. 5.
GBP5 activates the expression of IFNs. a The indicated luciferase promoter plasmids were transfected into 293T cells along with the GBP5 expression plasmid or a control plasmid. Luciferase assays were performed 24 h after H3N2 (MOI = 1) infection. b The indicated luciferase promoter plasmids were transfected into 293T cells along with the shGBP5 expression plasmid or a negative control. Luciferase assays were performed 24 h after H3N2 (MOI = 1) infection (left). Cells were harvested for Western blot analysis with the indicated antibodies (right). c A549 cells were transfected with the GBP5 expression plasmid or a control vector for 24 h (left), and transfected with the shGBP5 expression plasmid or a negative control vector for 24 h (right), then the cell viability was measured by the MTT assay. d A549 cells were transfected with the indicated plasmids and infected with IAV (MOI = 1) for 24 h, then the mRNA levels of IFNα, IFNβ, and IFNλ1 were measured by qRT-PCR. e A549 cells were transfected with the indicated plasmids and infected with IAV (MOI = 1) for 24 h, then the protein levels of IFNα and IFNλ1 were measured by ELISA. f A549 cells were transfected with the indicated plasmids and infected with IAV (MOI = 1) for 24 h. The protein levels of OAS1, PKR, and IRF3 were measured by Western blot and mRNA levels were measured by qRT-PCR. g A549 cells were transfected with the GBP5 expression plasmid or a control plasmid. Then, cytosolic and nuclear extracts were prepared at the indicated time points and were subjected to Western blot analysis. GAPDH and lamin A were used as markers for the cytosolic and nuclear fractions, respectively. Protein levels were measured by Western blot analysis with the indicated antibodies. All experiments were repeated at least 3 times with similar results. Bar graphs represent means ± SD; n = 3 (** p < 0.01; * p < 0.05).

