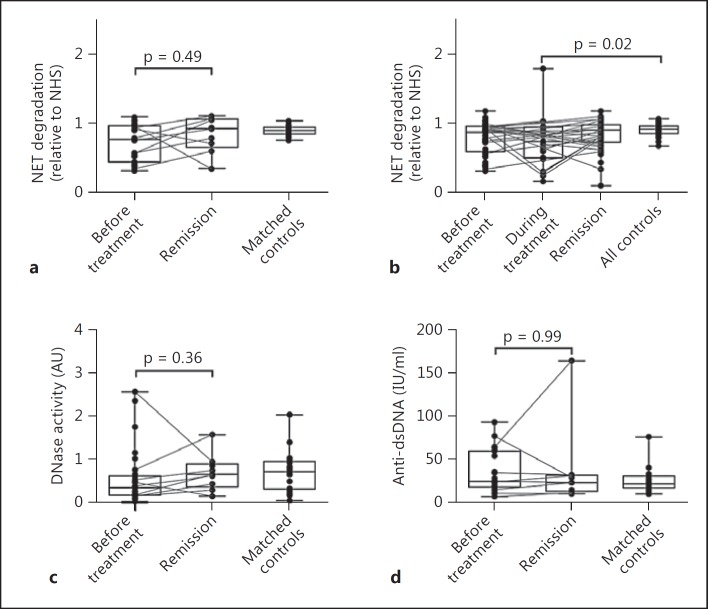
Fig. 3.
Degradation of NETs in STEC-HUS patients before treatment (n = 30) and in remission (n = 9) (a), in TMA patients before treatment (n = 74), during treatment (n = 23) and in remission (n = 48) (b) and in matched healthy controls (n = 24). Nuclease activity (c) and anti-dsDNA titres (d) in STEC-HUS patients before treatment and in remission compared to healthy controls. Multiple time points from the same patients are connected by a line (STEC-HUS, n = 8; TMA, n = 26). The significance of differences was calculated using a Kruskal-Wallis test with Dunn's post-test and is indicated by p values.

