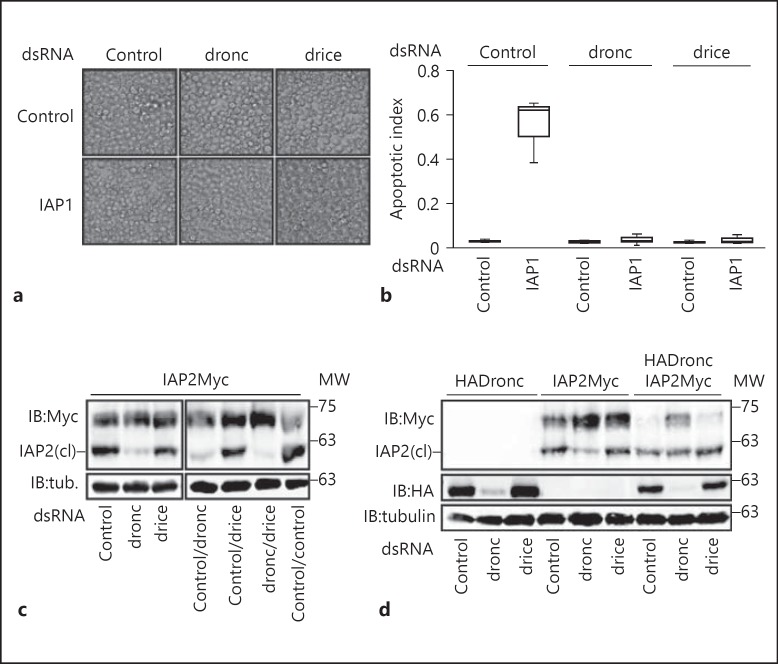
Fig. 5.
a Visualization of the induction of apoptosis in S2 cells treated with the indicated combinations of dsRNAs. b Quantification of the relative amount of apoptosis in a. Cells were defined as apoptotic if they displayed a visible amount of membrane blebbing. The apoptotic index represents the ratio of apoptotic cells to total cells. c, d Western blot analysis of lysates prepared from S2 cells that were transfected with the expression constructs indicated at the top of each gel, and with the dsRNA indicated at the bottom of the gel. Total cell lysates were immunoblotted with anti-myc and anti-HA antibodies where indicated. Tubulin levels were visualized for each membrane as a loading control. Cleaved IAP2 is indicated with IAP2(cl). MW is shown for each blot in kilodaltons.

