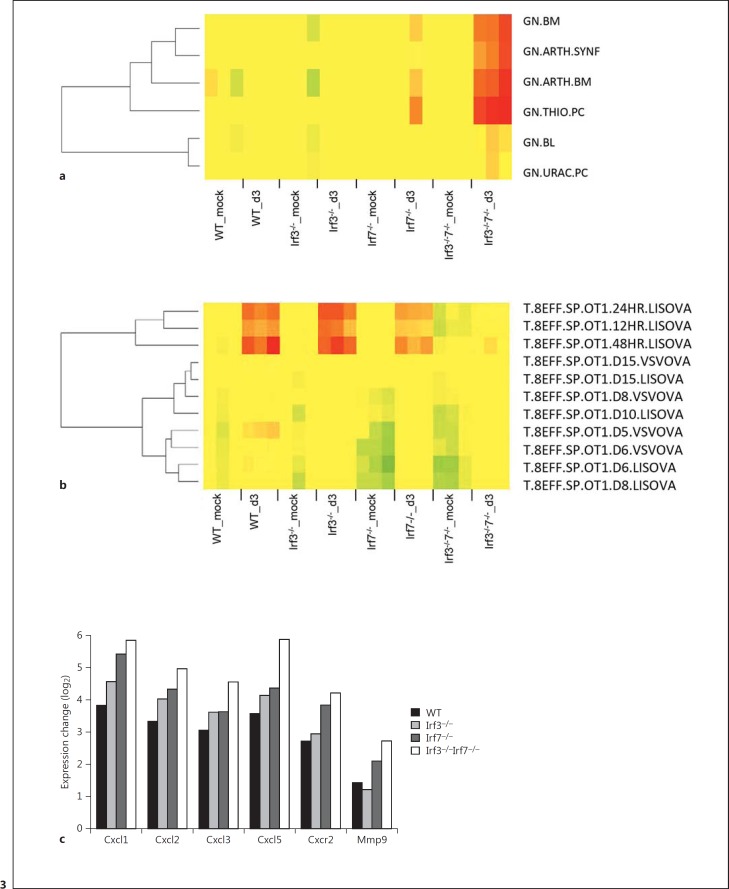
Fig. 3.
Changes in the relative numbers of immune cells in the lungs of WT, single KO, and DKO mice. The relative number of immune cells in the lungs of WT, single KO, and DKO mice (n = 3 for all groups) on day 3 pi after infection with 2 × 10³ FFU PR8M was determined by DCQ, based on gene expression values. Results from the analysis were visualized as heat maps for selected immune cell populations: granulocytes (a), T cells (b). A detailed description for the designation of the different immune cell types can be found at https://www.immgen.org/ListPDFs/Myeloid.pdf. c log2 gene expression values of the differences between infected mice and respective mock-infected controls (mean infected mice minus mean mock-treated controls) for Cxcl1, Cxcl2, Cxcl3, Cxcl5, Cxcr2, and Mmp9 from the lungs of WT, single KO, and DKO mice that were significantly regulated (based on ANOVA, p <0.001).

