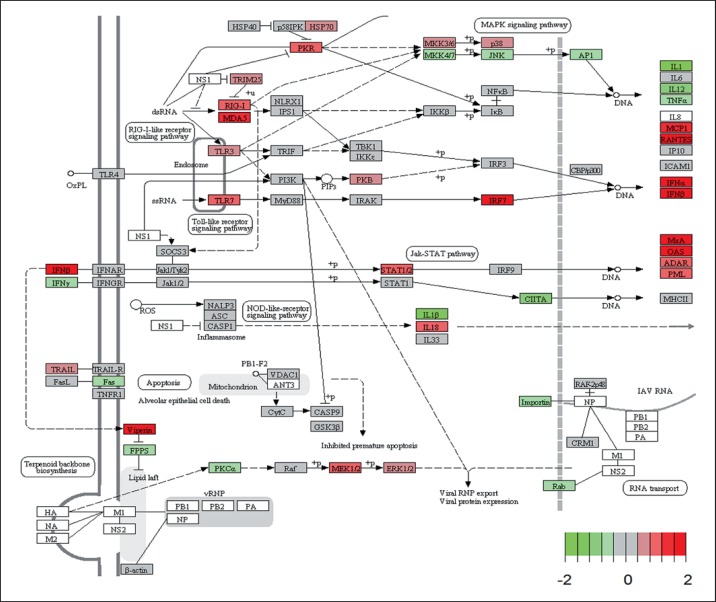
Fig. 7.
KEGG pathway view for influenza-activated genes. Mean differences between gene expression changes in Irf3−/−Irf7−/− mice (mean infected minus mean mock-infected controls) to WT mice (mean infected minus mean mock-infected controls) were calculated and visualized on the KEGG pathway ‘influenza A pathway: mmu05164’ using the ‘pathview’ package. The image was slightly modified (e.g. trimmed) for better visualization. Red indicates higher expression in WT mice and green indicates higher expression levels in DKO mice. The range for the color scale was set from −2 to 2 to increase sensitivity for small differences (total range was 6 to −3.6, 1st quantile −0.183, 3rd quantile 0.149).

