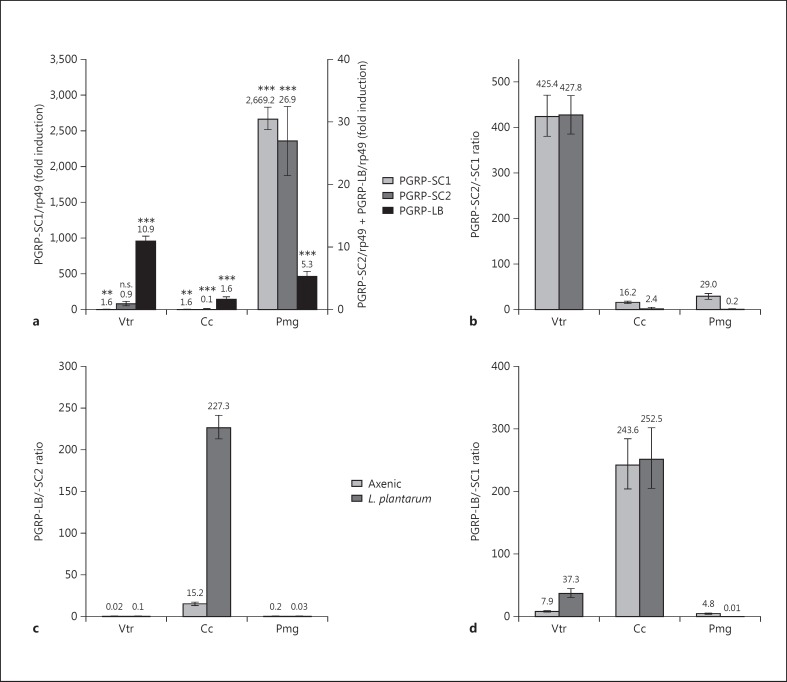
Fig. 2.
PGRP mRNA levels in L. plantarum-colonized gut domains. a Induction levels of PGRP-SC1, PGRP-SC2 and PGRP-LB mRNAs in gut domains of L. plantarum-colonized larvae compared to axenic larvae (= control value). Means ± SD of three independent experiments. Statistical significance of the results with Student's t test analysis is included: p > 0.05 (n.s.), ** p < 0.05 and *** p < 0.01. b-d Relative ratios between PGRP-SC2 and PGRP-SC1 (b), between PGRP-LB and PGRP-SC2 (c) and between PGRP-LB and PGRP-SC1 (d) mRNAs in different gut domains of axenic and L. plantarum-colonized larvae.

