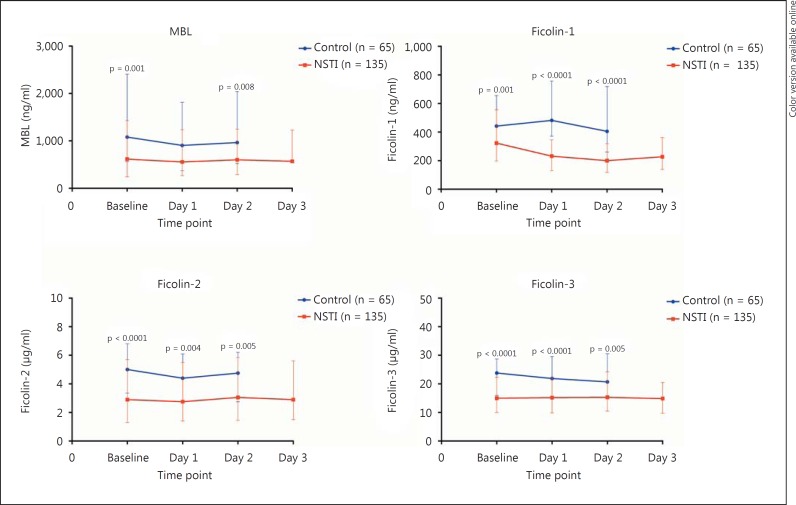
Fig. 1.
Levels of PRMs upon admission (baseline) and on the following days in patients with NSTI and in non-infected control patients. Values denote medians with IQR. Differences were analyzed with the Mann-Whitney U test. Microtiter plates were coated with monoclonal antibodies against Ficolin-1, Ficolin-2, Ficolin-3 and MBL. EDTA plasma samples were diluted in phosphate-buffered saline with 0.05% Tween (Ficolin-1 1:100, Ficolin-2 1:300, Ficolin-3 1:500, MBL 1:300).

