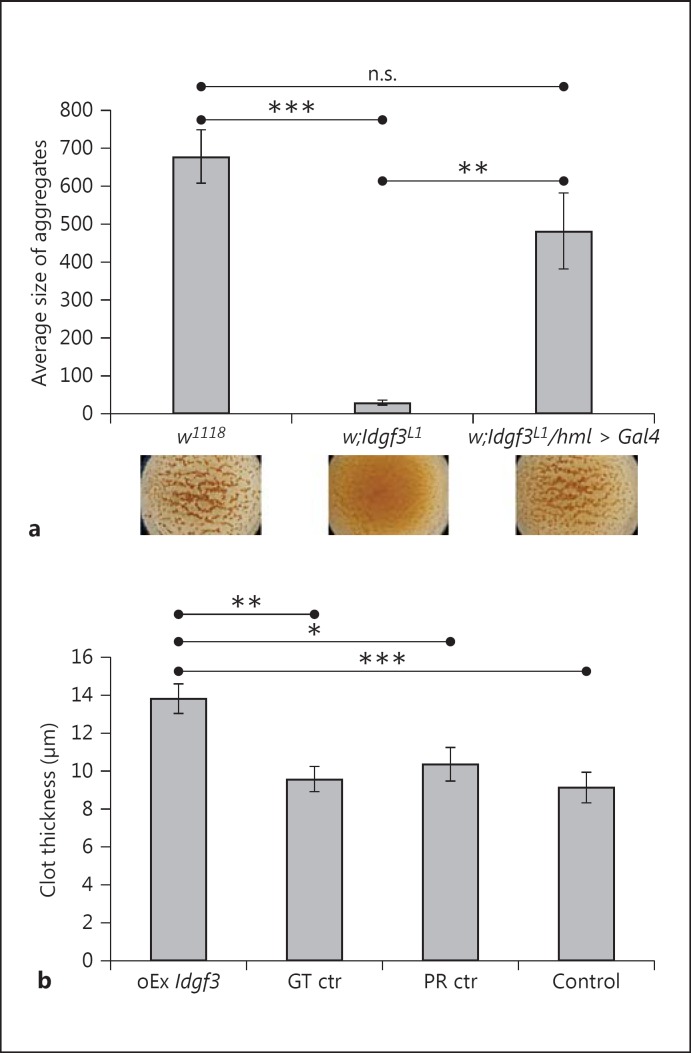
Fig. 3.
IDGF3 mutants show defects in clot formation. a Hemolymph preparations were used to detect clot formation using a previously described bead aggregation assay [22]. Idgf3L1 mutants lacked clot formation visible through a lack of bead aggregation (middle part of the figure underneath the diagram and quantification in the diagram) compared to controls (w1118). The clotting defect was rescued by ectopic expression of Idgf3 in hemocytes (Idgf3L1/hml > Idgf3). Data were analyzed using one-way ANOVA and the Tukey test. n.s. = Not significant. ** p < 0.01, *** p < 0.001; error bars represent SEM from 4 independent preparations. b Ubiquitous inducible overexpression of Idgf3 leads to more extensive clot formation measured as thickness of the clot. Control larvae (GT ctr = nontreated genotype control, PR ctr = mifepristone-treated driver control and Control = nontreated driver control) and overexpression larvae (oEx Idgf3) preparations of clots were stained with FITC-conjugated PNA and the thickness of the clots was measured using a confocal microscope. Experimental genotype: w;UAS-Idgf3/Act-Gal4:PR; driver control genotype: w;Act-Gal4:PR/+. The flies were treated 12 h with mifepristone (5 μg/ml) for 12 h. Data were analyzed using one-way ANOVA and the Tukey test. * p < 0.05, ** p < 0.01, *** p < 0.001; error bars represent SEM from 5 independent preparations measured repeatedly at multiple spots of the grid.

