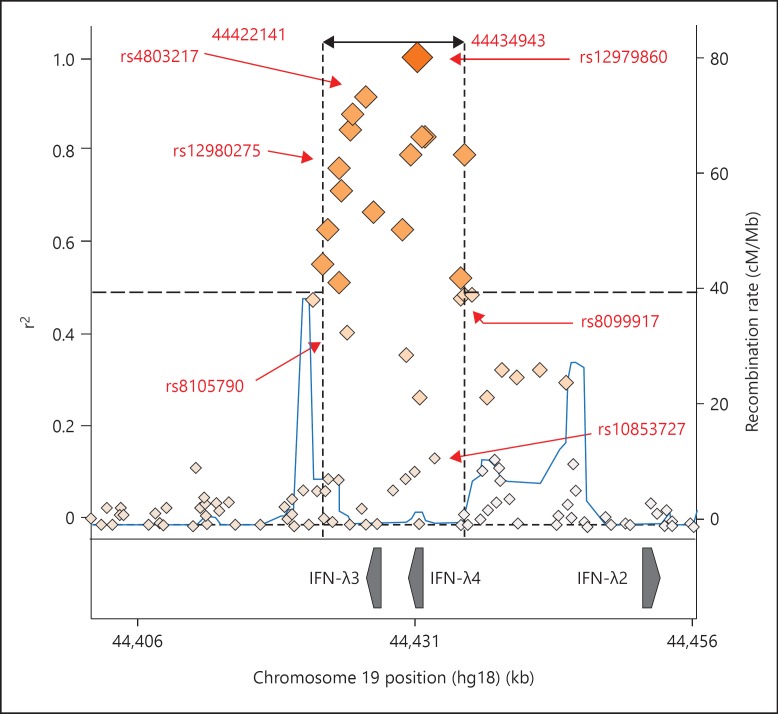
Fig. 2.
Regional LD plot with rs12979860. An LD plot was generated which highlights all SNPs within 50 bp up or downstream and in LD (r2 > 0.5) with rs12979860. SNPs discussed in this review, for which LD data is available, are highlighted. The plot was generated with SNP Annotation and Proxy Search (SNAP) using the 1000 Genomes Pilot 1 data set [101].

