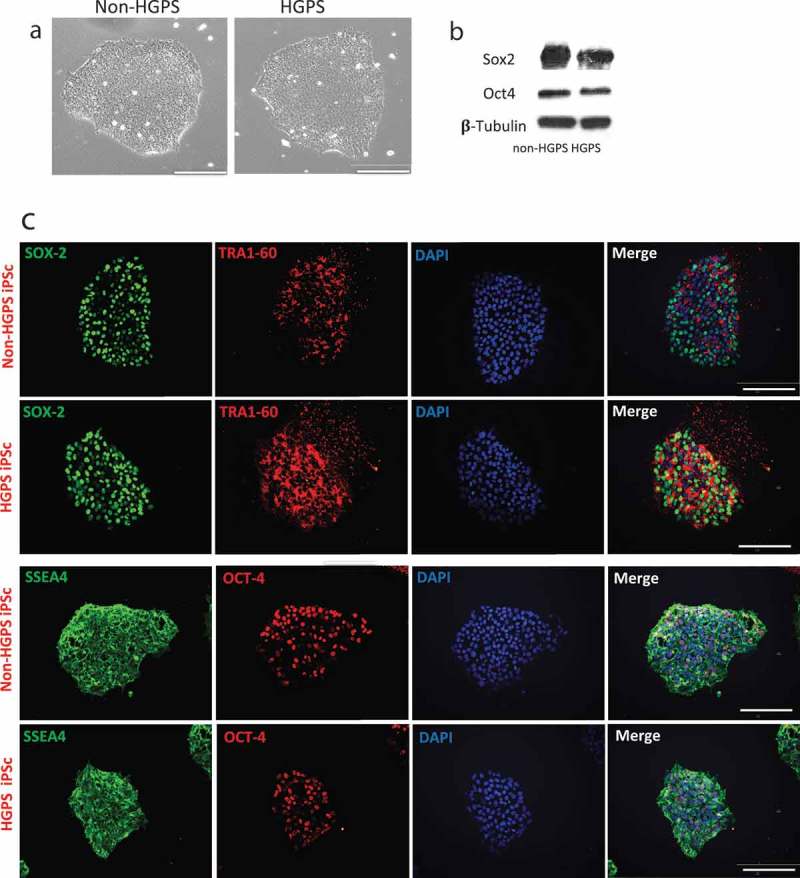
Figure 1.

Characterization of iPSCs. (a) Brightfield images of iPSC (HGPS 167–1Q and non-HGPS 168–1P) colonies cultured on matrigel coated dishes. (b) Western blotting analysis for pluripotency markers Sox2 and Oct4 in HGPS and non-HGPS iPSC. (c) Immunofluorescence staining for Oct4, SSEA–4, SOX2 and TRA1–60 in HGPS (167–1Q) and non-HGPS (168–1P) iPSCs show no difference in the expression of pluripotent stem cell-specific markers. White bar length 100 um. N = 3 experiments per donor cells.
