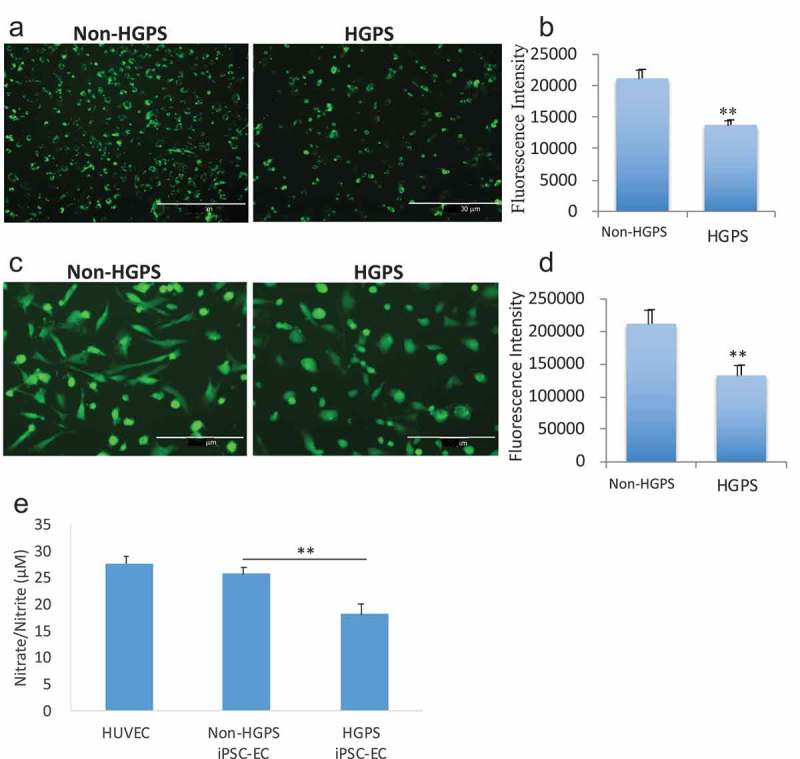
Figure 5.

Analysis of iPSCs-derived ECs functionality. (a) Immunofluorescence images showing the uptake of acetylated low-density lipoprotein in HGPS iPSC-EC and control. Fluorescence intensity is reported graphically in (b). (c) Immunofluorescence images of nitric oxide (NO), measured by DAF-FM staining, generated in HGPS and non-HGPS iPSC-ECs. Fluorescence intensity is reported graphically in (d). (e) Nitrate/Nitrite assay as measurement of nitric oxide. Images show HGPS 167–1Q and non-HGPS 168–1P cells. N = 3 experiments per donor cells, Student t-test was used in (b) and (d), ANOVA test was used in (e). **p ≤ 0.01.
