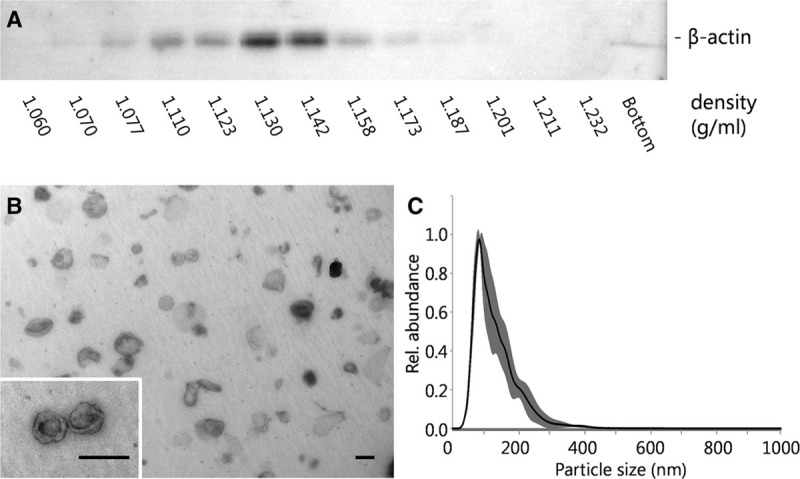
FIGURE 1.

sEVs from donor kidney perfusate. A, A representative immunoblot of sucrose density gradient fractions shows a peak signal at a density of 1.130 g/mL. B, Transmission electron microscope analysis of the peak fraction (scale bar = 100 nm) and (C) NTA analysis demonstrate the presence of 50–150 nm vesicles (SD in grey). NTA, nanoparticle tracking analysis; SD, standard deviation; sEVs, small extracellular vesicles.
