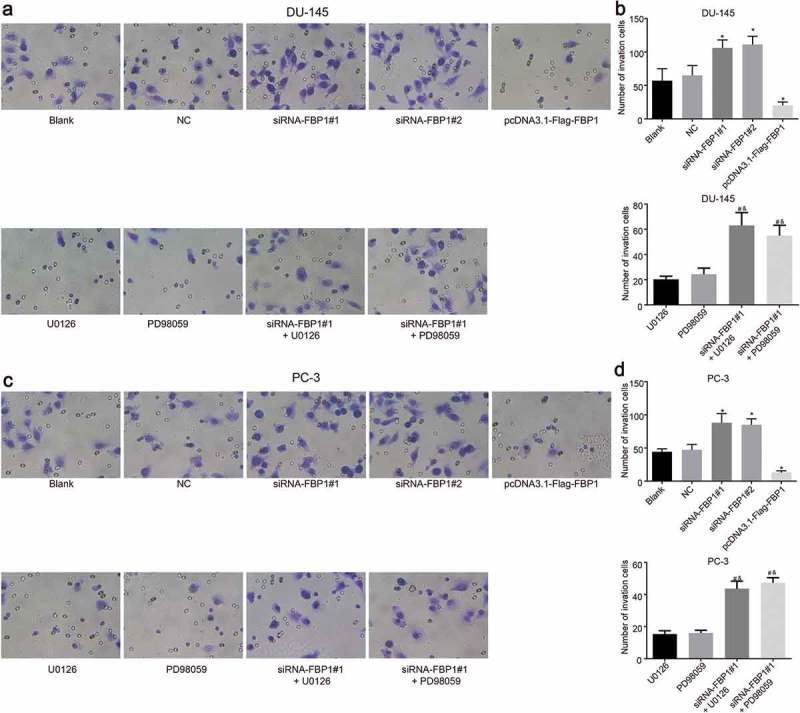
Figure 4.

FBP1 gene silencing promotes PCa cell invasion (× 400). A-B, Transwell invasive images and number of DU-145 cell. C-D, Transwell images and number of PC-3 cell. The number of migrating PCa cells was enumeration data, which were presented as mean ± standard deviation and analyzed by one-way ANOVA. The multiple comparison was analyzed by post-hoc Tukey test. The experiment was repeated three times. * p < 0.05 vs. the blank group; # p < 0.05 vs. the U0126 group; & p < 0.05 vs. the PD98059 group. FBP1, fructose-bisphosphatase 1; PCa, prostate cancer; ANOVA, analysis of variance.
