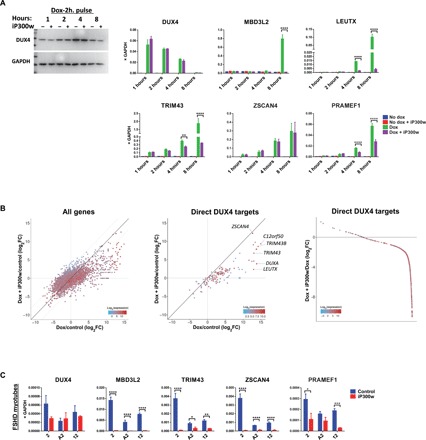
Fig. 2. iP300w disables transcription of DUX4-induced target genes.

(A) Western blot for DUX4 and RT-qPCR for DUX4 target genes in LHCN-iDUX4 cells pulse induced for 2 hours with dox (200 ng/ml) and then treated with 0.1 μM iP300w. Protein and RNA samples were harvested at 1, 2, 4, and 8 hours of treatment with iP300w. Data represent means ± SEM; ****P < 0.0001, **P < 0.01, and *P < 0.05 by two-way analysis of variance (ANOVA) with Tukey’s post hoc test. Results are presented as fold difference compared to GAPDH (n = 3). (B) RNA-seq in LHCN-iDUX4 cells induced for 12 hours with dox (200 ng/ml) and treated with 0.25 μM iP300w. Left: Total gene expression given as log2 fold change of dox-treated versus control cells on the x axis and iP300w + dox–treated cells versus controls on the y axis. Middle: Same analysis showing only presumed DUX4 direct targets, defined as at least eight-fold up-regulated by 6 hours (from the Choi et al., 2016 dataset) and with a DUX4 chromatin immunoprecipitation sequencing (ChIP-seq) peak within 10 kb of the transcription start site. Right: Effect of iP300w on all strongly up-regulated DUX4 target genes (defined as all genes up-regulated by dox at least eight-fold in the current 12-hour dataset), organized by magnitude of the iP300w effect. The great majority of these are down-regulated by iP300w. In all panels, color indicates the level of gene expression. (C) RT-qPCR for DUX4 and DUX4 target genes in myotubes from three different FSHD myoblast clonal cell lines (2, A2, and 12) after 12 hours of treatment with 0.25 μM iP300w (n = 9). ****P < 0.0001, ***P < 0.001, **P < 0.01, and *P < 0.05 by two-way analysis of variance (ANOVA) with Tukey’s post hoc test.
