
Fig. 1. Skeletal muscle mitochondrial PE promotes oxidative capacity.
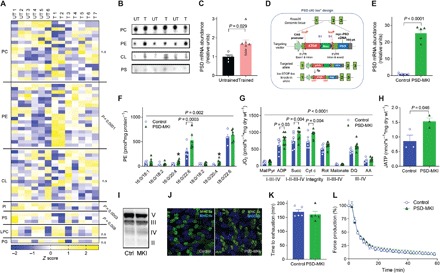
(A to C) Untrained (UT, n = 6) or trained (T, n = 7 or 8) C57BL6/J mice. (A) Skeletal muscle mitochondrial phospholipidome. LPC, lyso-PC; PG, phosphatidylglycerol; n.s., not significant. (B) Mitochondrial phospholipids quantified by thin-layer chromatography (TLC). (C) Skeletal muscle PSD mRNA. (D to L) Studies on PSD-MKI mice (n = 3 to 9). (D) Generation of mice with conditional knock-in of PSD. 5′UTR, 5′ untranslated region. (E) Skeletal muscle PSD mRNA. (F) Muscle mitochondrial PE. (G and H) Rates for oxygen consumption or ATP production in permeabilized muscle fibers with Krebs cycle substrates. DQ, duroquinol; AA, antimycin A. (I) Protein abundance of respiratory complexes II to V. (J) Myosin heavy chain (MHC) fiber-type distribution. (K) Endurance running test. (L) Ex vivo twitch endurance test. Means ± SEM.