
Fig. 3. PE deficiency in skeletal muscle mitochondria.
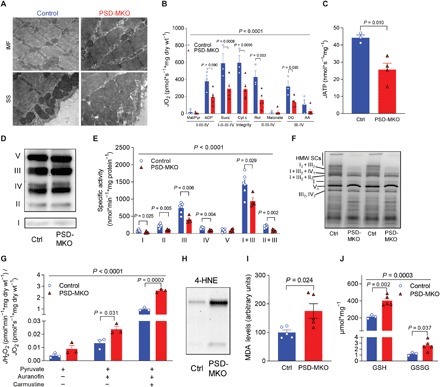
(A) Electron micrograph of subsarcolemmal (SS) and intermyofibrillar (IMF) mitochondria. (B and C) Rates of oxygen consumption and ATP production in permeabilized fibers with Krebs cycle substrates (n = 3 to 5). (D) Protein abundance of respiratory complexes I to V. (E) Activities of respiratory enzymes (n = 4 to 6). (F) Blue native gel of isolated mitochondria revealing supercomplexes (n = 4). High–molecular weight supercomplexes (HMW SCs). (G) Mitochondrial H2O2 production and emission with pyruvate normalized to O2 consumption (n = 3). (H) 4-HNE. (I) MDA (n = 5). (J) Reduced glutathione (GSH) and oxidized glutathione (GSSG) (n = 3 to 5). Means ± SEM.