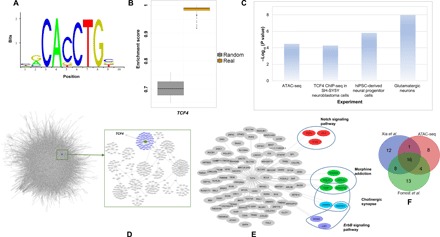
Fig. 2. Summary of TCF4 regulons in the CMC and CNON data.

(A) TCF4 motif from the JASPAR database used in the analysis. (B) TCF4 binding site enrichment scores (based on TCF4 motifs from the JASPAR database) among the TCF4 regulons compared to that of a set of random genes. (C) Enrichment P values of the TCF4 regulons, compared with several gene sets, including the predicted TCF4 sites from ATAC-seq, the differentially expressed genes from our TCF4 knockdown experiments, and the predicted TCF4 binding sites in neuroblastoma cells by ChIP-seq (P value obtained from Fisher’s exact test). (D) A schematic of the network created from CMC data as well as the TCF4 targets. (E) TCF4 targets from CMC and CNON data combined with some of the associated pathways. (F) List of overlapping predicted TCF4 targets with an ATAC-seq on hiPSC–Glut_Ns and two ChIP-seq datasets.
