
Fig. 3. TCF4 knockdown in hiPSC-derived neural progenitor cells (NPCs) and Glut_Ns (from a SCZ patient line).
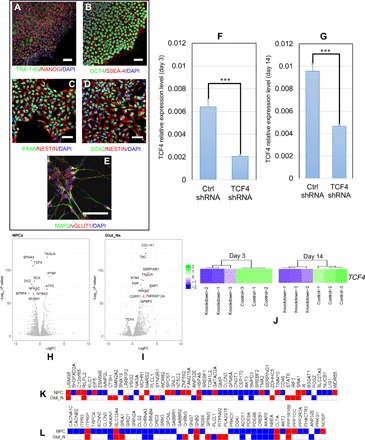
(A) Representative immunofluorescence (IF)–staining images of hiPSCs. hiPSCs are stained positive for pluripotency markers TRA-1-60 (green) and NANOG (red). (B) Representative IF-staining images of hiPSCs. hiPSCs are stained positive for OCT4 (green) and SSEA-4 (red). (C) Representative IF-staining images of NPCs (3 days after plating cells): NPCs are stained positive for PAX6 (green) and NESTIN (red). (D) Representative IF-staining images of NPCs (3 days after plating cells): NPCs are stained positive for NESTIN (red) and SOX2 (green). (E) Representative image of day 14 neurons stained positive for MAP2 (green) and vGLUT1 (red). (F) TCF4 knockdown efficiency measured by qPCR in NPCs (3 days after plating). (G) TCF4 knockdown efficiency measured by qPCR in Glut_Ns (14 days after neuronal induction). (H) Volcano plot of DE genes in NPCs. (I) Volcano plot of DE genes in Glut_Ns. (J) TCF4 expression levels at days 3 and 14 in RNA-seq data (K) Overlap of the DE genes upon TCF4 knockdown with a list of GWAS-implicated SCZ risk genes (up- and down-regulated genes are shown in red and blue, respectively; white cells indicate that the gene is not DE). (L) Overlap of the DE genes upon TCF4 knockdown with a list of credible GWAS risk loci (up- and down-regulated genes are shown in red and blue, respectively; white cells indicate that the gene is not DE). Scale bars, 50 μm in all images. Cell nuclei are stained with 4′,6-diamidino-2-phenylindole (DAPI) (blue) (A to E), and glyceraldehyde-3-phosphate dehydrogenase (GAPDH) is used as the endogenous control to normalize the TCF4 expression for qPCR. Error bars, mean ± SD (n = 4). ***P < 0.001, Student’s t test, two-tailed, heteroscedastic.