
Fig. 4. TCF4 knockdown in hiPSC-derived Glut_Ns in two independent cell lines CD07 and CD09 from unaffected control subjects.
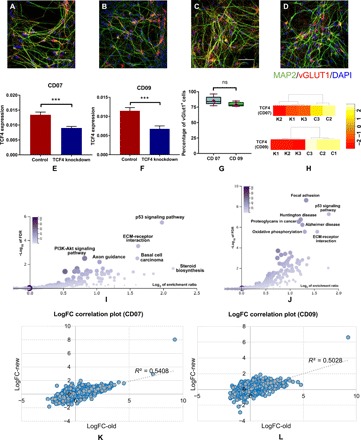
(A and B) IF staining of hiPSC-derived Glut_Ns from the CD07 control line. (C and D) IF staining of hiPSC-derived Glut_Ns from the CD09 control line; MAP2, green; vGlut1, red; DAPI, blue. Scale bar, 50 μm. (E and F) Real-time qPCR (qRT-PCR) result of TCF4 expression level in two different lines, demonstrating knockdown efficiency; GAPDH is used as the endogenous control to normalize the TCF4 expression for qPCR; error bars, mean ± SD (n = 6 to 8); ***P < 0.001, Student’s t test, two-tailed, heteroscedastic. (G) Percentage of vGlut1-positive cells derived from two different hiPSC lines; cell counts were from five images in each line. (H) TCF4 expression levels in knockdown (K1, K2, and K3) and control samples (C1, C2, and C3) in the generated RNA-seq data on CD07 and CD09. (I) Pathway enrichment analysis results on the identified DE genes in CD07 (color legend indicates the number of overlapped DE genes with the corresponding pathway). (J) Pathway enrichment analysis results on the identified DE genes in CD09 (color legend indicates the number of overlapped DE genes with the corresponding pathway). (K) Correlation plot of the log fold changes (logFC) of the Glut_Ns from the SCZ cell line (“old”) and CD07. (L) Correlation plot of the log fold changes of the Glut_Ns from the SCZ cell line (“old”) and CD09. ns, not significant.