
Fig. 5. Enrichment of SCZ de novo SNVs in TCF4-associated gene expression changes from NPCs and Glut_Ns.
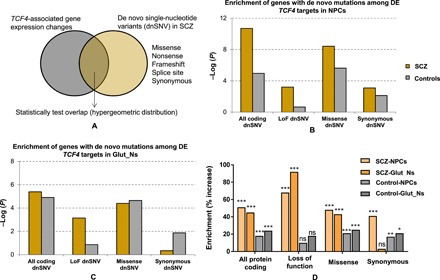
(A) Analysis framework. (B) Enrichment P values (−log10-transformed) of all DE genes at day 3 (NPCs). The P value on the y axis obtained from a hypergeometric test was used to test the statistical significance of each overlap (number of shared genes between lists) and using all protein coding genes as a background set. (C) Enrichment P values (−log10-transformed) of all DE genes at day 14 (Glut_Ns). (D) Enrichment of SCZ dnSNVs in TCF4-associated gene expression changes.