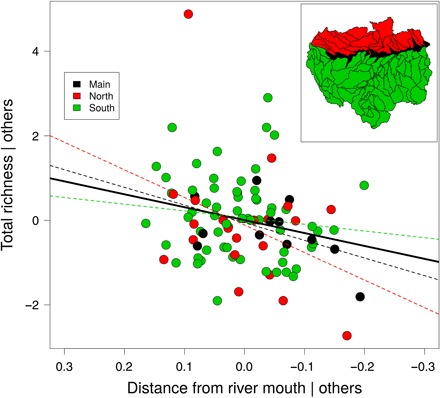
Fig. 2. Partial correlation plot (i.e., Pearson residuals) of the distance from river mouth on subdrainage basins total fish species richness after controlling for all other predictors considered in our richness model.

The overall decrease in sub-basins species richness from upriver to downriver is statistically significant (solid line, table S3) (Pearson’s r = 0.24, P = 0.020, n = 97). Note that removing the outlier sub-basin (red point on top of the graph) from the model changes neither the significance nor the trend of the relationship (Pearson’s r = 0.21, P = 0.040, n = 96). The atypical richness pattern (i.e., a decreasing trend in species richness from upriver to downriver) is depicted for the Amazon main channel (black) and subdrainage basins located north (red) or south (green) of this mainstem and is marginally significant for basins located within the mainstem (Pearson’s r = 0.51, P = 0.089, n = 12) or north (Pearson’s r = 0.36, P = 0.098, n = 22) of the mainstem (red and black dashed lines), but not significant for sub-basins located south of the mainstem (Pearson’s r = 0.13, P = 0.320, n = 63).
