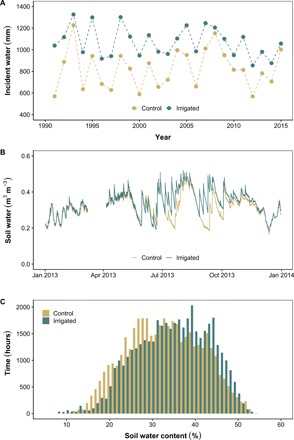
Fig. 1. Characterization of experimental water regimes.

(A) Total annual rainfall at the Konza Prairie Biological Station (Control) and total rainfall plus water applied as part of the ITE (Irrigated). (B) Volumetric soil water content (daily means across six sets of sensors) in control and irrigated transects for an example year. (C) Distribution of soil water content at the experimental site for an 8-year period (2008–2015).
