
Fig. 1. In vitro and in vivo metformin treatment leads to an age- and sex-dependent expansion of the NSC pool.
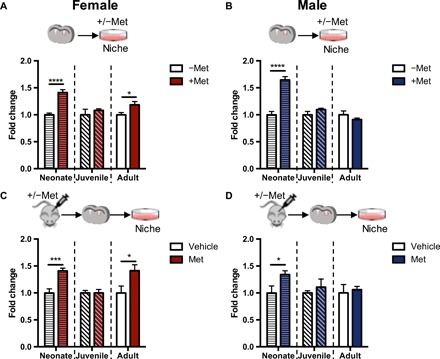
(A and B) Fold change in the number of neurospheres from the SVZ of neonatal (P8), juvenile (P17), and adult (7 weeks) females [(A) neonate: −Met, n = 16 mice; +Met, n = 16 mice; P < 0.001; juvenile: −Met, n = 7 mice; +Met, n = 7 mice; adult: −Met, n = 15 mice; +Met, n = 15 mice; over three to seven independent experiments per age group, P < 0.05; Student’s t test] and males [(B) neonate: −Met, n = 15 mice; +Met, n = 15 mice; P < 0.001; juvenile: −Met, n = 10 mice; +Met, n = 10 mice; adult: −Met, n = 11 mice; +Met, n = 11 mice; over four to five independent experiments per age group, Student’s t test] following in vitro metformin administration (1 μM). (C and D) Fold change in the number of neurospheres from the SVZ of neonatal (P8), juvenile (P17), and adult (7 weeks) females [(C) neonate: −Met, n = 4 mice; +Met, n = 5 mice; P < 0.05; juvenile: −Met, n = 9 mice; +Met, n = 8 mice; adult: −Met, n = 10 mice; +Met, n = 8 mice; P < 0.05; over three to five independent experiments per age group, Student’s t test] and males [(D) neonate: −Met, n = 6 mice; +Met, n = 6 mice; P < 0.05; juvenile: −Met, n = 6 mice; +Met, n = 5 mice; adult: −Met, n = 7 mice; +Met, n = 5 mice; over three to four independent experiments per age group, Student’s t test] following in vivo administration with vehicle or metformin (20 or 200 mg/kg). Experiments across different ages were analyzed using a Student’s t test. *P < 0.05, ***P < 0.005, ****P < 0.001. Met, metformin.