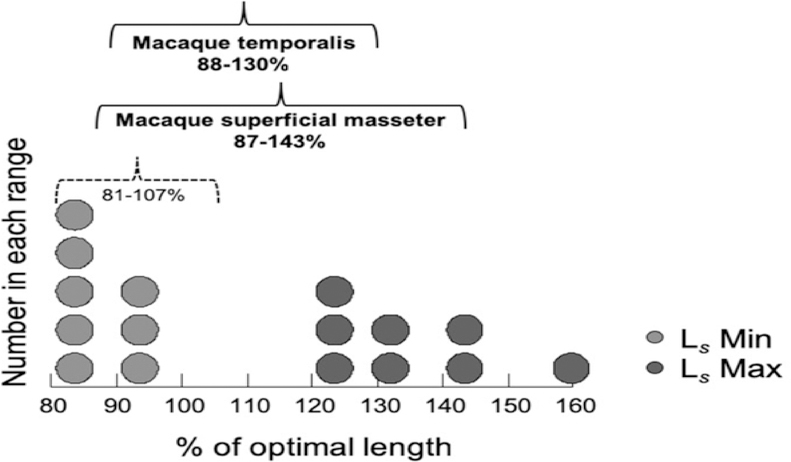
Figure 7.
Dot density histogram of relative sarcomere lengths (measured sarcomere length divided by a standard sarcomere length of 2.41 μm; reported as % of optimal length, L0) for macaque anterior and posterior superficial masseter and anterior and posterior temporalis muscles. Light grey dots represent relative Ls Min (at occlusion) and dark grey dots represent relative Ls Max (at maximum jaw gape), for each muscle region, averaged by species. The average range is 87–143% L0 for macaque masseter and 88–130% L0 for the temporalis (solid black brackets). The range for relative sarcomere lengths for these macaque jaw-adductors includes a large portion of the descending limb of the L-T curve, and is both wider and shifted to the right of the L-T curve in comparison with the range reported for jaw and limb muscles (81–107%; dotted black bracket) across a variety of vertebrates (Burkholder & Lieber, 2001). The macaque pattern may be characteristic of facially prognathic primates and other mammals that generate relatively wide maximum jaw gapes.

