
Figure 3.
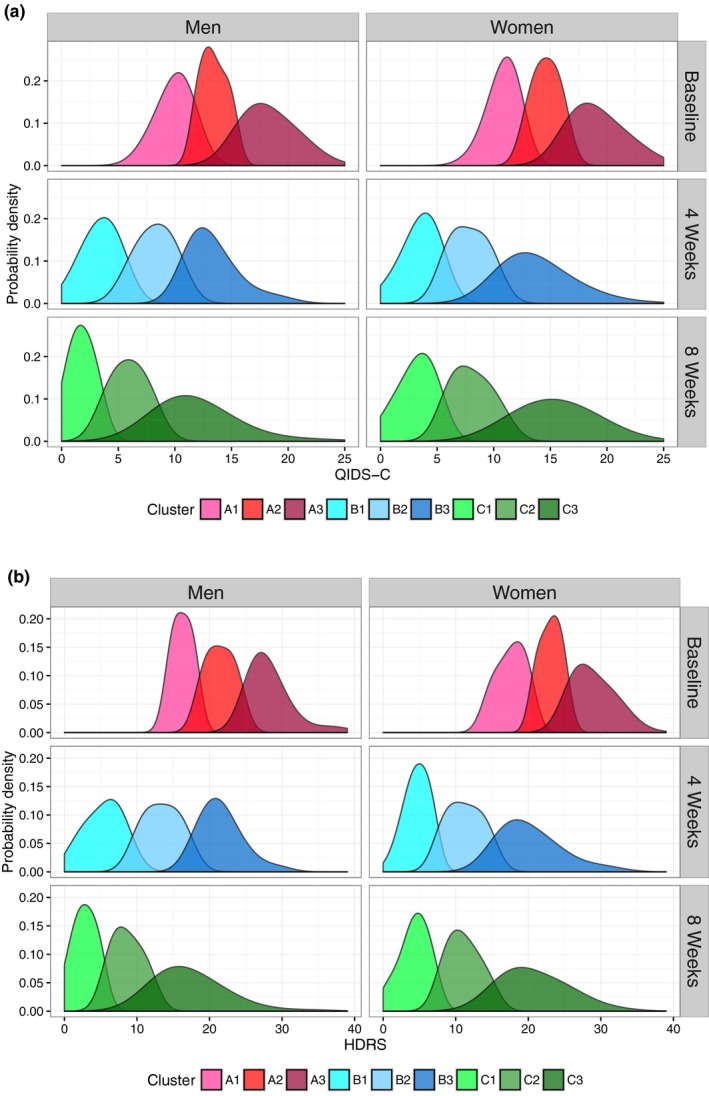
Depressive symptom–based clusters identified by data‐driven unsupervised learning using Gaussian mixture models. Probability densities of symptom severity in clusters at baseline, 4 weeks, and 8 weeks of the Mayo Clinic Pharmacogenomics Research Network Antidepressant Medication Pharmacogenomic Study trial for both the Quick Inventory of Depressive Symptomatology (QIDS‐C) (a) and Hamilton Depression Rating Scale (HDRS) (b) scales. Probability densities are proportional to the fraction of patients with the associated symptom severity scores.