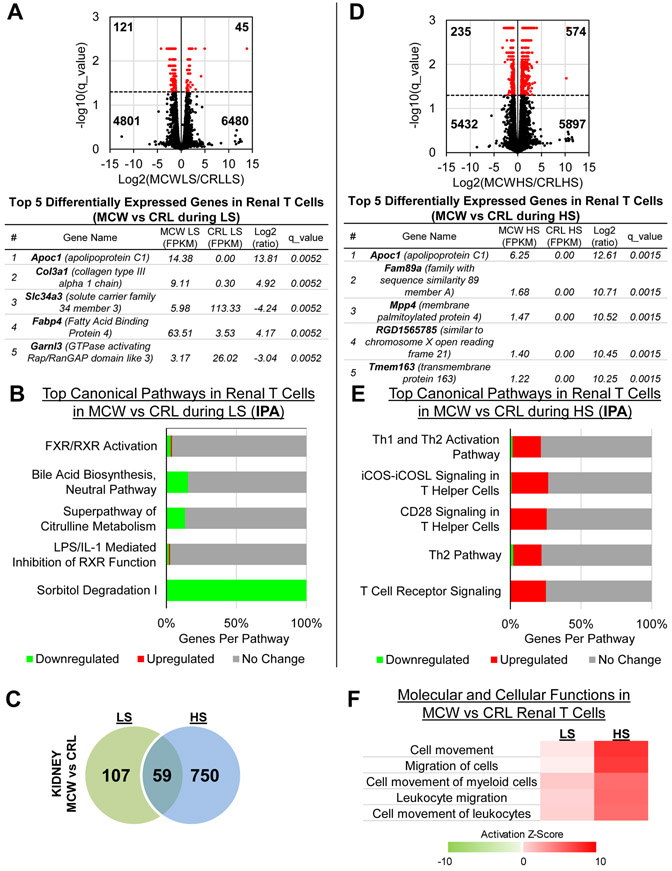
Figure 6. Comparison of casein-fed SS/MCW and grain-fed SS/CRL renal T-cells during LS or HS.
(A) Volcano plot demonstrating significantly up- and downregulated genes (red) when comparing SS/MCW to SS/CRL renal T-cells during LS, and the top 5 DEGs. (B) Functional analysis by IPA of these DEGs showed downregulation of metabolism-related pathways in SS/MCW compared to SS/CRL. (C) Venn diagram of all significant DEGs in kidney T-cells during LS and HS when comparing SS/MCW to SS/CRL rats in each group. (D) Volcano plot demonstrating significantly up- and downregulated genes (red) when comparing SS/MCW to SS/CRL renal T-cells during HS, and the top 5 DEGs. (E) Functional analysis by IPA of these DEGs showed upregulation of inflammatory, T-cell signaling pathways in SS/MCW compared to SS/CRL during HS. (F) Heatmap indicating the activation of migratory and homing mechanisms in the SS/MCW T-cells compared to SS/CRL, which was exacerbated upon HS challenge. n=4 pools/group, 3 rats/pool.

